How to Calculate a Weighted Average: Formula & Examples
Multiply each value by its weight, add the products, then divide by the total weight. Full formula, five steps, worked examples and four error checks.
weighted averageformulastep by step
Multiply each value by its weight, add the products, then divide by the total weight. Full formula, five steps, worked examples and four error checks.
weighted averageformulastep by step
To calculate a weighted average, multiply every value by its own weight, add those products into a weighted sum, then divide that sum by the total of the weights. Three multiplications, two additions, one division. The whole method fits on a napkin.
The hard part is never the arithmetic. It is knowing which number is a value and which is a weight, and remembering that the denominator is the total weight rather than the number of rows.
This guide covers the formula, the five steps, worked examples using percentages, quantities, credits and frequencies, plus four checks that catch an error in under a minute. Every figure is worked in full, so you can follow on paper or drop the same numbers into the weighted average calculator.
A weighted average is an average where some values count more than others. Each value carries a weight that sets its influence on the result. A simple average treats every value as equally important. A weighted average does not, which is why it describes the real world far more often.
Think about the last time you scored anything. A vendor, a job candidate, a rental apartment. You almost certainly did not treat every criterion as equal. Location mattered more than the paint colour. The moment you admit that, you have left the arithmetic mean behind for a weighted mean.
The weight is not the value. That one sentence prevents most errors people make. A weight answers “how much does this count?” A value answers “what did it score?” Mixing them up scrambles everything, and the result still looks plausible, which is what makes the slip expensive.
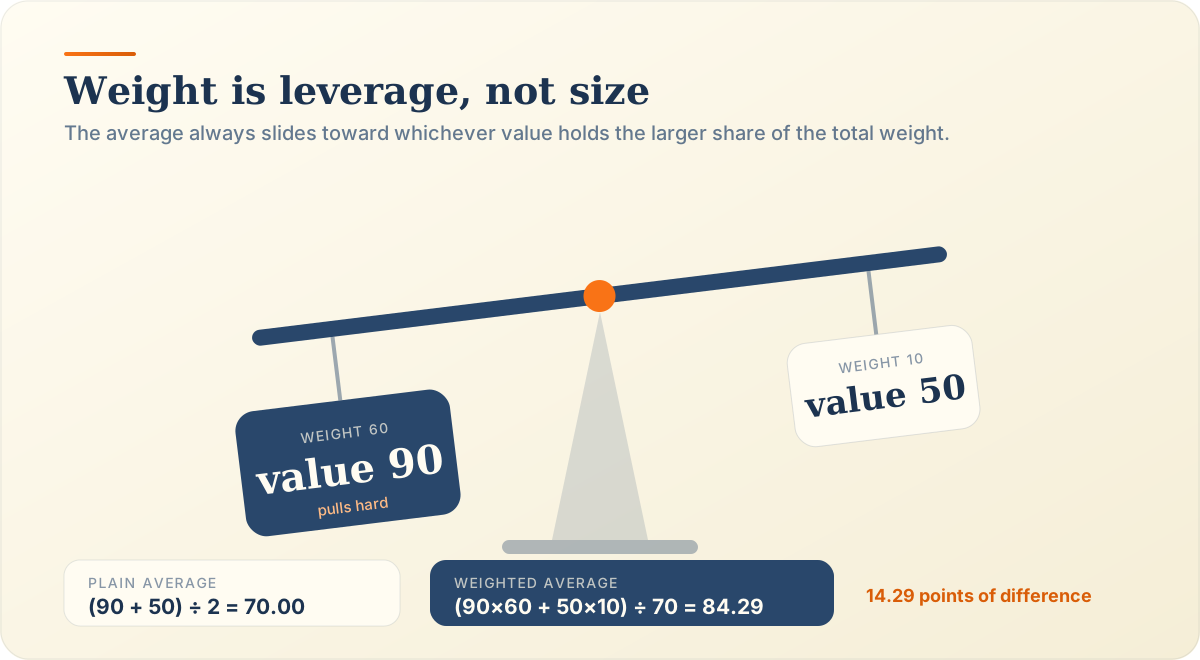
One property is worth carrying with you. The result always lands between the smallest and the largest value in your data set. Never below. Never above. An answer outside that range is an error, and you now know it before anyone else does.
The weighted average formula divides the sum of every value multiplied by its weight by the sum of all the weights. In symbols, the weighted mean equals sigma w times x, divided by sigma w.
Values are the raw measurements you want to summarise. Scores, prices, marks, interest rates, ratings, anything numeric. Weights are the importance you attach to each value.
In a syllabus the weights are percentages. In a stock room they are units purchased. On a transcript they are credit hours. In a loan portfolio they are outstanding balances. The unit changes constantly. The formula never does.
Read it as two totals stacked on each other. The numerator is the weighted sum, built by multiplying each value by its weight and adding every product. The denominator is the total weight, built by adding the weight column alone.
That final division does real work. It converts raw weights, whatever scale they use, into proportions of the whole. Weights of 3, 5 and 2 become shares of 30, 50 and 20 percent without you rewriting a number. The weighted mean calculator runs that conversion on every keystroke.
List each value beside its weight, multiply the two together on every row, add the products to get the weighted sum, add the weight column to get the total weight, then divide the weighted sum by the total weight. The quotient is your weighted average.
Write them as a two-column table, one row per item, even for three rows. The table is not decoration. It is the most effective error prevention tool in the process, because a misaligned pair becomes visible the moment it exists. Label the columns out loud as you write them.
Work down the table and fill a third column. Each entry is one value times its own weight, and nothing else on the row touches it. These products are called weighted values. Keep them unrounded, because rounding twice is how a result drifts by a tenth of a point.
Sum that third column into one figure, the weighted sum. It looks enormous next to your original values, which is normal. A total of 8,580 for scores in the 70s and 90s is not a mistake, because it has not been divided yet.
Now total the weight column on its own. Do this even when you are certain the percentages reach 100, because “certain” is where errors live. A syllabus totalling 97 percent is missing an assessment, and you have just found it.
One division finishes it. Weighted sum on top, total weight underneath. Round to two decimal places unless your institution or contract says otherwise.
88 × 45 = 3960 —
72 × 25 = 1800 —
94 × 30 = 2820 —
Weighting lifts the result 1.13 points above the plain average.
Drag the sliders above before reading on. Push the weakest score to a weight of 70, then drop it back. The scores never change. The answer swings several points anyway, and that swing is the entire reason the method exists.
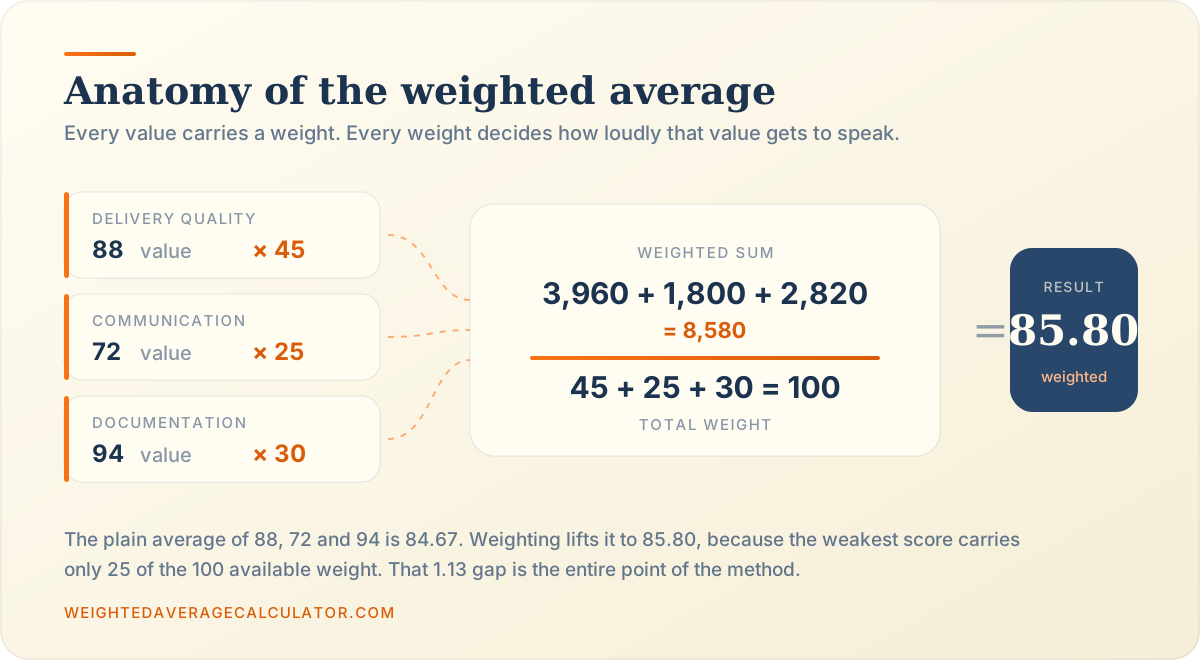
A quarterly vendor scorecard rates delivery quality 88, communication 72 and documentation 94, with weights of 45 percent, 25 percent and 30 percent. The weighted sum is 8,580 and the total weight is 100, so the weighted average is 85.80.
Percentage weights are the friendliest case, because the total weight is already 100.
| Criterion | Score | Weight | Score × weight |
|---|---|---|---|
| Delivery quality | 88 | 45% | 3,960 |
| Communication | 72 | 25% | 1,800 |
| Documentation | 94 | 30% | 2,820 |
| Totals | — | 100 | 8,580 |
8,580 ÷ 100 = 85.80
The simple average of 88, 72 and 94 is 84.67. The weighted result reaches 85.80 because the weakest score, communication, holds only a quarter of the available weight. That 1.13 point gap decides whether this vendor clears an 85 threshold.
Now a case where nothing totals 100. A freelance contractor bills three projects at three different hourly rates, and wants the true average rate across the quarter.
| Project | Hourly rate | Hours | Rate × hours |
|---|---|---|---|
| Brand refresh | $65.00 | 12 | $780.00 |
| Platform migration | $90.00 | 30 | $2,700.00 |
| Maintenance retainer | $48.00 | 8 | $384.00 |
| Totals | — | 50 | $3,864.00 |
3,864 ÷ 50 = $77.28 per hour
The plain average of the three rates is $67.67. The blended rate is $77.28, almost ten dollars higher, because the expensive project absorbed 30 of the 50 hours. Quoting $67.67 would underprice the next contract badly.
Reverse the division. Multiply your answer by the total weight and you should land back on the weighted sum. Here, 77.28 times 50 returns 3,864 exactly.
Then glance at the range. The rates ran from $48 to $90, and $77.28 sits inside. It leans toward $90, which is correct, because that project carried the most hours.
Nothing changes. Divide the weighted sum by whatever the weights actually total. The formula normalises any scale automatically, so weights of 3, 5 and 2 work exactly as well as 30, 50 and 20.
This question trips up more people than any other, and the answer is anticlimactic. Weights carry no obligation to reach 100. They never did. For the full treatment, including totals above 100 and when a wrong total is a real warning, see weighted average when weights do not total 100%.
Decimal weights are the same weights with the decimal point moved. Take the vendor scorecard and write the weights as 0.45, 0.25 and 0.30.
(88 × 0.45) + (72 × 0.25) + (94 × 0.30) = 39.60 + 18.00 + 28.20 = 85.80
The weighted sum is now 85.80 and the total weight is 1.00. Dividing by 1 changes nothing, so the answer matches the percentage version. Decimal weights skip the final division, which is why portfolio allocations and probability models prefer them.
Small whole numbers are common on assignment briefs. Attendance counts 3, a project counts 5, a quiz counts 2. Those total 10, not 100, and the method is unchanged.
(88 × 3) + (74 × 5) + (95 × 2) = 264 + 370 + 190 = 824 → 824 ÷ 10 = 82.40
Because the division is a conversion, not a formality. It turns raw weights into shares of the whole, and shares determine influence.
One test makes this obvious. Multiply every weight by ten, so 3, 5 and 2 become 30, 50 and 20. The weighted sum grows tenfold to 8,240, the total weight grows tenfold to 100, and the answer stays at 82.40. Scaling the whole column changes nothing, which proves the denominator does the normalising. The weighted percentage calculator prints each row’s share beside it so you can watch this happen.
Use the frequency as the weight. Multiply each value by how many times it occurs, add those products, then divide by the total frequency. The result is the mean of the full data set without ever writing out every observation.
Frequency tables hide this calculation in plain sight. A value appearing 412 times is a value with a weight of 412. Writing out 412 copies of the number 5 and averaging them gives the same answer as multiplying 5 by 412 once. The second approach just respects your afternoon.
A product page shows 700 ratings. The star level is the value and the review count is the frequency.
| Star rating | Reviews | Rating × reviews |
|---|---|---|
| 5 stars | 412 | 2,060 |
| 4 stars | 168 | 672 |
| 3 stars | 57 | 171 |
| 2 stars | 23 | 46 |
| 1 star | 40 | 40 |
| Totals | 700 | 2,989 |
2,989 ÷ 700 = 4.27 stars
Notice what the simple average would say. Adding 5, 4, 3, 2 and 1 and dividing by five gives 3.00, a full 1.27 stars lower, because it pretends 40 one-star reviews matter as much as 412 five-star reviews. Every rating system online runs the weighted version for this reason.
Percentages, quantities and credits all behave identically inside the formula. Multiply, add, divide by the total. Only the unit attached to the weight changes, never the arithmetic.
A scorecard hands you the weights already. They total 100, so the final division looks almost cosmetic.
| Criterion | Score | Weight | Score × weight |
|---|---|---|---|
| Delivery quality | 88 | 45% | 3,960 |
| Communication | 72 | 25% | 1,800 |
| Documentation | 94 | 30% | 2,820 |
| Totals | — | 100 | 8,580 |
8,580 ÷ 100 85.80
Buy the same product three times at three prices. Units bought are the weights, and nothing totals 100.
| Purchase lot | Unit price | Units | Price × units |
|---|---|---|---|
| March lot | $4.20 | 120 | $504.00 |
| June lot | $3.80 | 300 | $1,140.00 |
| October lot | $5.10 | 80 | $408.00 |
| Totals | — | 500 | $2,052.00 |
2,052 ÷ 500 $4.10
A degree transcript weights each module by its credit load. A 45-credit module counts 1.5 times a 30-credit one.
| Module | Mark | Credits | Mark × credits |
|---|---|---|---|
| Research Methods | 74 | 30 | 2,220 |
| Corporate Finance | 61 | 45 | 2,745 |
| Data Analysis | 68 | 45 | 3,060 |
| Totals | — | 120 | 8,025 |
8,025 ÷ 120 66.88
The most common case in education and performance reviews. Weights arrive already set, they total 100, and the division is nearly cosmetic. Confirm that total anyway. For syllabus weights, the weighted grade calculator also converts letter grades, and the guide to a weighted average of grades covers final exam planning.
Units, hours, reviews, shares, litres. Anything countable works as a weight, and the total lands where it lands. This family covers inventory costing, blended pricing and rating systems. Accountants meet it as weighted average cost, which the weighted average cost calculator and the weighted average inventory calculator compute from purchase lots.
Transcripts weight each module by its credit load, so a 45-credit module counts 1.5 times a 30-credit one. Grade point averages and weighted average marks are both built this way. Use the weighted GPA calculator for a 4.0 or 5.0 scale, the weighted average mark calculator for percentage-based transcripts, and read weighted vs unweighted GPA if the AP and Honours bonuses are the part confusing you.
Draw three columns on paper, fill in the products by hand, then total the weight column and the product column. One long division finishes it. Small whole-number weights keep the arithmetic manageable.
Rule three columns. Value, weight, product. Write every row before you multiply anything, because setting up and calculating at once is how rows get skipped. Leave a blank line underneath for the two totals.
Multiply row by row. For a value of 88 and a weight of 3, write 264. Keep every product in full, then add the column.
Small weights make this quick. If your weights are 20, 30 and 50, divide them all by 10 first. Weights of 2, 3 and 5 return the same answer with a third of the effort, which is the scaling property doing you a favour.
Estimate before you divide. With scores of 88, 74 and 95, and the heaviest weight on the 74, the answer belongs in the low 80s. A long division returning 82.40 confirms the estimate. One returning 8.24 means a misplaced decimal, and you caught it yourself.
Back at a desk, a spreadsheet removes the arithmetic. The weighted average in Excel and Google Sheets guide covers SUMPRODUCT divided by SUM, and Microsoft documents the SUMPRODUCT function directly.
Five errors cause nearly every wrong weighted average: using the simple average, pairing the wrong value with the wrong weight, dividing by the row count, using the wrong total weight, and mixing percentages with decimals in one column.
Off by 1.13 points too low
Never divide by the row count while a weight column exists.
Off by 3.50 points too low
Read each row left to right, out loud, before you multiply anything.
Off by absurd, and mercifully obvious
The denominator is the sum of the weights, never the count of the rows.
Off by 13.37 marks too high
Add the weight column yourself. Do not assume it reaches 100.
Off by 1.77 points too low
Pick one notation for the whole column and stay inside it.
The default reflex. Add everything, divide by how many things there are, ignore the weight column sitting right there. It produces a number that looks fine and is quietly wrong by a point or two, which is often the margin that matters.
Rows drift. A copied column lands one cell low, and the strongest score inherits the smallest weight. In the scorecard above that single slip costs 3.50 points. Read each row left to right before multiplying.
The weighted sum is correct, then it meets the row count instead of the total weight. This one is almost a gift, because the answer comes out absurd. A vendor score of 2,860 is not a subtle error.
Far more dangerous, because the answer stays believable. Credits totalling 120 divided by 100 out of habit turns a 66.88 into an 80.25. Always add the weight column rather than assuming its total.
One weight typed as 0.45 while its neighbours stay at 25 and 30 gives a total weight of 55.45 and an answer of 84.03. Pick one notation per column and stay inside it.
Confirm the total weight matches what you expected, rebuild the weighted sum a second time, check the result sits between the smallest and largest value, and confirm it leans toward the heaviest weight. Four checks, under a minute.
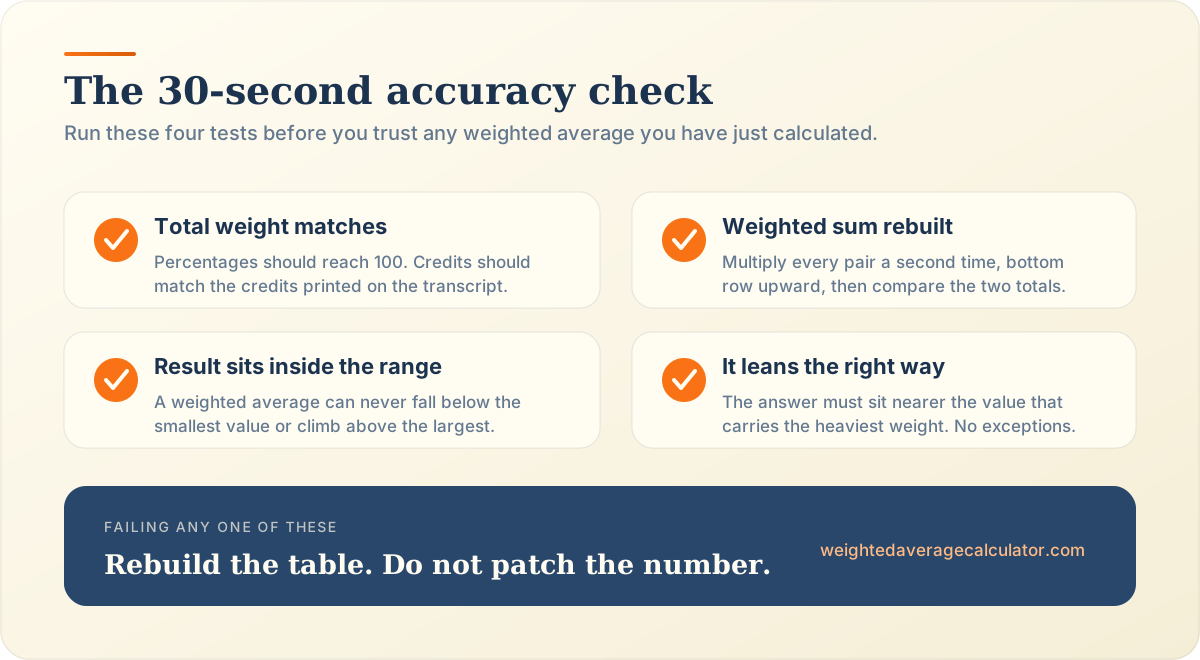
Add the weight column and compare it to what the source document promised. Percentages should reach 100, credits should match the transcript, units should match the stock ledger. A mismatch means a row is missing or duplicated.
Multiply every pair again, working from the bottom row upward. Reversing direction breaks the pattern that let the first error through. Compare the two totals and investigate any gap rather than splitting the difference.
Your answer must sit between the smallest and the largest value, and it must lean toward whichever value holds the most weight. Both checks are cheap and catch a surprising share of errors on their own.
The NIST Engineering Statistics Handbook covers measures of location formally if you want the statistical grounding behind that range property.
Divide the sum of each value multiplied by its weight by the sum of all the weights. Written out, that is (value₁ × weight₁ + value₂ × weight₂ + …) ÷ (weight₁ + weight₂ + …). The numerator is the weighted sum, the denominator is the total weight, and course grades and bond yields both use it unmodified.
No. Weights can total 1, 10, 120, 700 or any other number. Dividing by the total converts whatever scale you used into proportions automatically. Percentages reaching 100 are simply convenient, because dividing by 100 is easy in your head. A frequency table totalling 700 reviews works as well.
Yes, and they often are. Review counts run into the thousands and share volumes into the millions. Inventory units, loan balances and populations all exceed 100 routinely. The formula has no upper limit, because the denominator rescales everything. A VWAP calculator divides by daily share volumes for this reason.
Yes. Decimal weights of 0.45, 0.25 and 0.30 match percentage weights of 45, 25 and 30. They total 1, so the final division leaves the weighted sum unchanged. Portfolio allocations and probability distributions nearly always use decimals. The only rule is consistency, since mixing 0.45 with 25 in one column produces a meaningless total.
The calculation collapses into the simple average. Three values weighted 5, 5 and 5 give the same result as three values with no weights at all. This is a sanity check rather than a curiosity. Set every weight equal in the lab above and the result snaps onto the plain average immediately.
Yes, and it is one of the most common uses. Treat each frequency as the weight for its value, then follow the same five steps. A table with 412 five-star reviews multiplies 5 by 412, and the total frequency becomes the total weight. The answer matches averaging all 700 observations individually.
Pick the tool that matches your weight column. Each one runs the formula on this page and prints the weighted sum and total weight separately, so you can check the working.
Still unsure which number belongs in the weight column? The frequently asked questions page answers that case by case, and the weighted average calculator on the homepage prints the weighted sum and total weight beside every result, so you can see where your answer came from.
Divide by whatever the weights actually total, not by 100. Worked examples above and below 100, normalising, and when a wrong total is a real warning.
weightsnormalizationweighted average
Multiply each holding's return by its share of portfolio value, then add. Formula, worked example, contributions, asset classes and the measures it is not.
portfolioinvestment returnsweighted average
Calculate Weighted Average Online
The weighted average calculator multiplies each value by its weight, adds the weighted sum, divides by the total of weights, and prints the weighted average beside the standard arithmetic mean. Course grades, GPA, portfolio returns, and probability distributions all run through the same 4 steps.
Open the Weighted Average Calculator