Weighted Average When Weights Do Not Total 100%
Divide by whatever the weights actually total, not by 100. Worked examples above and below 100, normalising, and when a wrong total is a real warning.
weightsnormalizationweighted average
Divide by whatever the weights actually total, not by 100. Worked examples above and below 100, normalising, and when a wrong total is a real warning.
weightsnormalizationweighted average
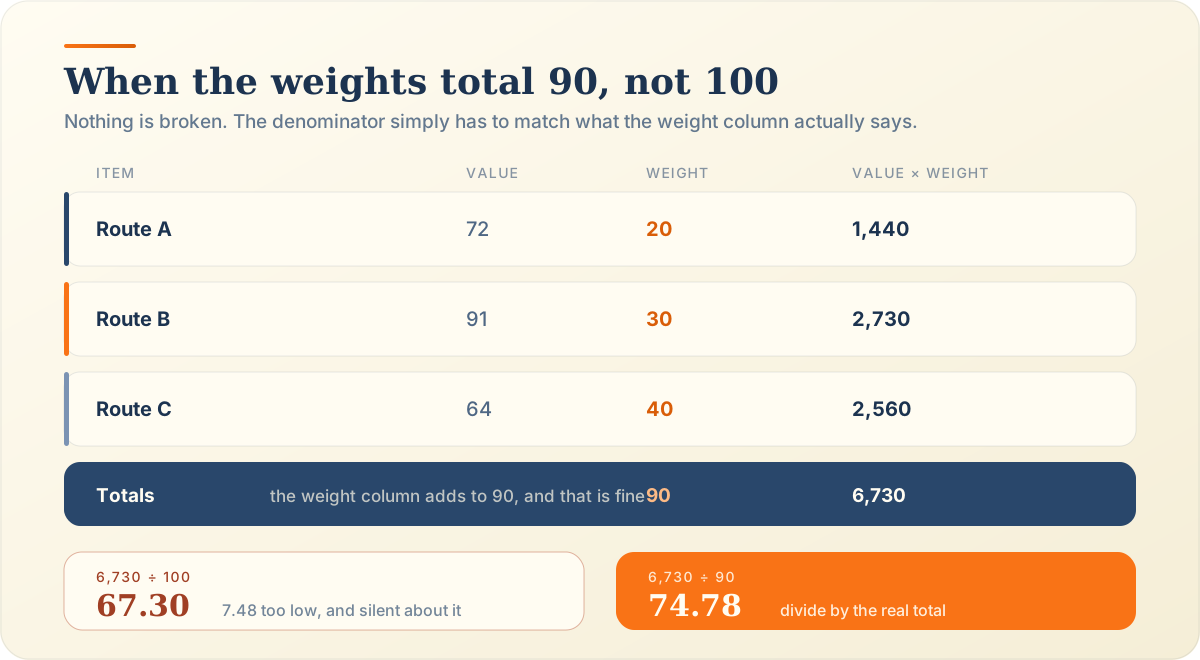
Three delivery routes score 72, 91 and 64, weighted 20, 30 and 40. Those weights total 90. Divide the weighted sum by 100 anyway, out of pure habit, and you report 67.30 instead of 74.78.
Nothing errors. Nothing turns red. You just published a number that is 7.48 points wrong and looks entirely plausible.
Here is the thing almost nobody says plainly. Weights were never obliged to reach 100. This guide covers totals above and below it, when to normalise, when a wrong total is a genuine warning sign, and the six mistakes that follow from assuming 100. The weighted average calculator and the weighted mean calculator handle any total, and how to calculate a weighted average covers the base method.
No. Weights can total any positive number. Dividing by the total weight converts whatever scale you used into shares of the whole, which is why 20, 30 and 40 work exactly as well as 20, 30 and 50.
Percentages are convenient, so they became the default. A column adding to 100 lets you read each row’s influence without doing any arithmetic, which is genuinely useful when you are explaining a result to someone else.
Convenience is not a rule. The formula was never written to expect percentages, and treating 100 as a requirement is how the habit of dividing by it takes hold.
Assignment briefs, partial datasets and rubrics land here constantly. Our routes total 90, and the calculation is entirely valid.
Rubric points, unit counts, credit hours and dollar amounts routinely exceed 100. A 250-point weight column is a design choice, not a defect.
Our warehouse example below uses weights of 50, 75 and 125. Nobody would describe a zone as being worth “125 percent” of anything, and nobody needs to. The weight is a relative size, and 125 is simply two and a half times 50.
6,730 ÷ 90 74.78 Valid. Common on assignment briefs and partial datasets.
9,230 ÷ 100 92.30 Valid, and the only case where dividing by 100 is safe.
23,075 ÷ 250 92.30 Valid. Rubric points, unit counts and dollar values land here constantly.
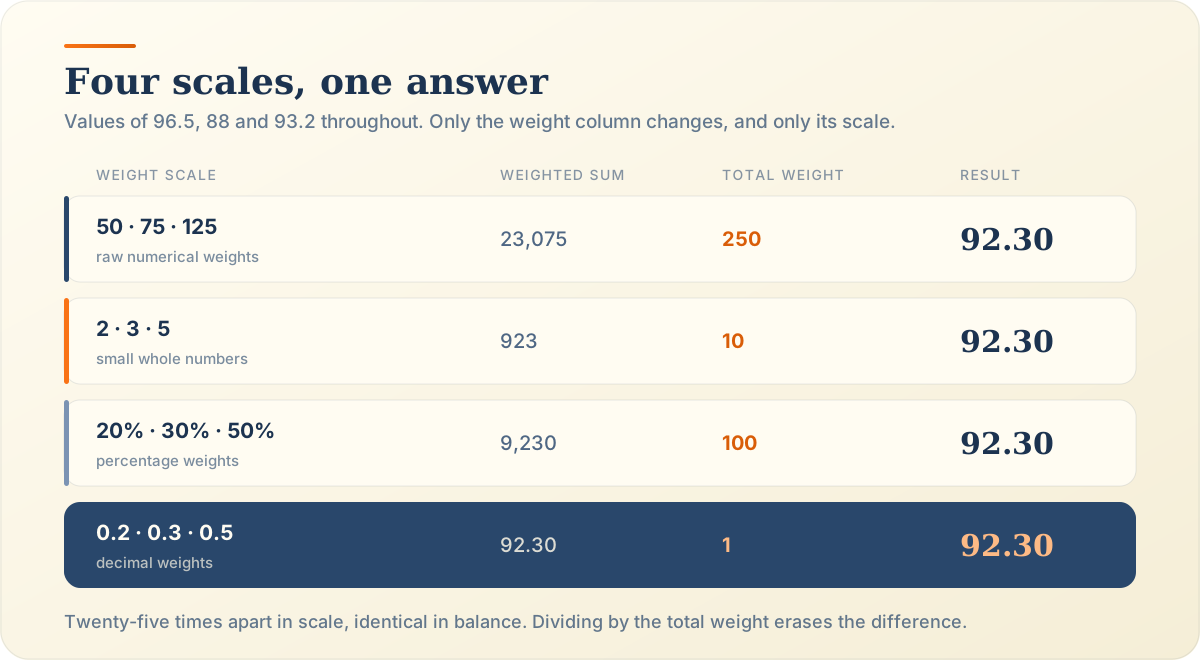
The second and third cards return the same answer from wildly different weights, because 20, 30 and 50 describe the same balance as 50, 75 and 125.
Only when the column claims to describe a complete allocation. A syllabus that totals 94% is missing an assessment, and that is worth chasing.
The formula divides by the sum of the weights, whatever that sum happens to be. The denominator adapts automatically, so no conversion step is needed before you calculate anything.
Weighted average = ∑(value × weight) ÷ ∑ weight
Because that division is what turns raw weights into proportions. Wolfram MathWorld defines the weighted mean with exactly this denominator, and no assumption about its size.
Nothing, provided the denominator matches. Our 6,730 over 90 gives 74.78, and the same 6,730 over 100 gives a number describing nothing.
Identical logic. Decimal weights totalling 1 make the final division cosmetic, since dividing by 1 leaves the weighted sum exactly where it was.
That is why probability distributions and portfolio allocations favour decimals. The convenience is real, but it is convenience, not correctness. A column of 0.2, 0.3 and 0.5 is no more valid than one of 2, 3 and 5.
List values and weights, multiply each pair, add the products, add the weight column, then divide the weighted sum by that total. The method is unchanged. Only the denominator differs from what you expected.
One row per item. Resist any urge to rescale the weights before you start.
72 times 20 gives 1,440. Keep every product unrounded.
1,440 plus 2,730 plus 2,560 gives 6,730. This is your numerator.
20 plus 30 plus 40 gives 90. This is the step people skip, and skipping it is the whole article.
The weights total 90, so dividing by 100 understates the result by 7.48. Set every weight so they reach 100 and the two answers finally agree.
6,730 divided by 90 gives 74.78. Set every weight so the column reaches 100 and both answers in the lab finally agree.
Values of 72, 91 and 64 weighted 20, 30 and 40 produce a weighted sum of 6,730 and a total weight of 90, giving 74.78. Dividing by 100 would have reported 67.30.
| Route | Score | Weight | Score × weight |
|---|---|---|---|
| Route A | 72 | 20 | 1,440 |
| Route B | 91 | 30 | 2,730 |
| Route C | 64 | 40 | 2,560 |
| Totals | — | 90 | 6,730 |
Multiply row by row. Route C contributes 2,560 despite the lowest score, because it carries the heaviest weight.
Add the weight column and write the answer down. Ninety, not a hundred.
6,730 ÷ 90 = 74.78
74.78 sits between 64 and 91, as it must. A weighted average can never escape the range of its own values, so an answer outside that band means the denominator is wrong.
It also leans below the simple average of 75.67, which is the second check. Route C scored lowest and carries the heaviest weight, so the result should drag downward. It does.
Values of 96.5, 88 and 93.2 weighted 50, 75 and 125 produce a weighted sum of 23,075 over a total weight of 250, giving 92.30. A weight total of 250 is perfectly legitimate.
| Zone | Accuracy | Weight | Accuracy × weight |
|---|---|---|---|
| Zone 1 | 96.5 | 50 | 4,825 |
| Zone 2 | 88.0 | 75 | 6,600 |
| Zone 3 | 93.2 | 125 | 11,650 |
| Totals | — | 250 | 23,075 |
96.5 times 50 gives 4,825. Nothing about a weight of 125 troubles the arithmetic.
23,075 ÷ 250 = 92.30
Because 50, 75 and 125 describe the same balance as 20%, 30% and 50%. Scale is irrelevant. Only relative size matters, which the weighted percentage calculator shows by printing each row’s share.
Normalising divides every weight by the total weight, converting the column into decimals that sum to 1. It changes how the weights read, never what they do, and the final answer is identical either way.
Rescaling a weight column so it sums to 1 or 100, without changing the balance between the rows. Think of it as switching currency rather than changing the price.
It is useful for communication and unnecessary for calculation. If you normalise, do it because a reader needs to see the shares, not because you believe the formula requires it.
20 over 90 gives 0.2222. 30 over 90 gives 0.3333. 40 over 90 gives 0.4444.
Multiply by 100. Route C holds 44.44% of the influence, which the raw 40 never made obvious.
Start with the weights as written. They total 90, which is neither 1 nor 100, and the calculation works perfectly well as it is.
The answer stays at 74.78 through every stage. If yours moves, you normalised and then divided again.
No. Raw numbers, percentages and decimals all produce identical results, because the formula divides by the total weight in every case. Weights of 2, 3 and 5 represent the same relative weighting as 20%, 30% and 50%.
Units, hours, credits and counts work directly. Keeping the original units also keeps the column checkable against a source document.
Familiar and readable. Just confirm the total rather than assuming it, as what a weighted average is argues across other fields.
Portfolio allocations and probability models prefer these, because dividing by 1 is free.
Totals 250. Nothing here resembles a percentage, and nothing needs to.
Totals 10. The same relative weighting, twenty-five times smaller.
Totals 100. Familiar, convenient, and no more correct than the others.
Totals 1. The division is cosmetic, which is why allocations prefer decimals.
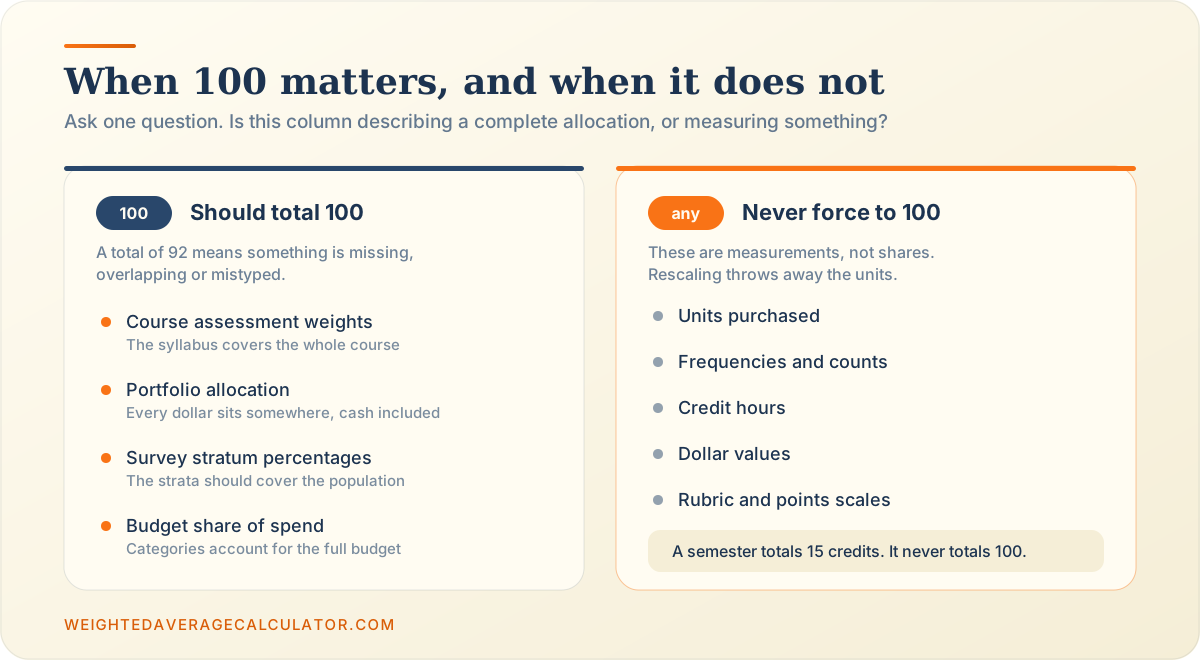
Quantities, frequencies, credit hours and dollar values are measurements rather than shares. Rescaling them to 100 adds a conversion step, discards the units that made them verifiable, and gains nothing.
These describe a complete allocation. A total of 92 means a category is missing, overlapping or mistyped.
These are measurements, not shares. Rescaling them to 100 adds a conversion step and removes the units that made them checkable.
Units bought, litres poured, parcels shipped. The weighted average cost calculator divides by units for exactly this reason.
Counts of occurrences. Four hundred and twelve reviews is a count, and counts do not normalise meaningfully.
A semester totals 15 credits, never 100. Forcing it is busywork, as calculating weighted grades and GPA demonstrates.
Dollar amounts weight portfolio returns directly, covered in weighted average portfolio returns.
Rubric points, priority scores and internal rating scales. If someone designed the scale deliberately, respect it.
If a system explicitly defines weights as percentages representing a complete allocation, a total other than 100% may indicate missing categories, overlapping categories, or an input error.
A syllabus covers the whole course by definition. A total of 94% means an assessment is missing, and the weighted grade calculator flags the shortfall.
Every dollar sits somewhere, cash included. A 92% allocation usually means someone forgot the cash position.
Strata are designed to cover a population. A shortfall signals a gap in the sampling frame, not a harmless rounding artefact.
Find the missing category before you calculate. Normalising a broken allocation hides the gap and produces a confident answer built on absent data.
Six mistakes cause almost every wrong answer here: dividing by 100, dividing by the row count, normalising twice, mixing weight types, using inconsistent scales, and quietly ignoring a missing weight.
The headline error. It is right only when the weights genuinely total 100, and nobody checks.
6,730 over three rows gives 2,243.33. Mercifully absurd, which is why this one rarely reaches a report.
Convert 20, 30 and 40 into decimals, then divide by 90 again, and you get 0.83 instead of 74.78. Once normalised, the denominator is 1.
Credits beside percentages in one column produces a total that means nothing, and a denominator built from that total is meaningless too. One weight type per calculation, every time.
The giveaway is a weight column you cannot describe in one unit. If you cannot finish the sentence “weighted by …”, you have mixed two systems.
A single 0.45 among weights of 25 and 30 gives a total weight of 55.45 and a quietly wrong answer.
A column totalling 85 when it should reach 100 is data telling you something. Investigate before you divide.
Add the weight column and compare it to expectation, recompute each product, redo the calculation with normalised weights, then confirm both methods agree. Disagreement means you divided twice.
Write it down explicitly rather than holding it in your head. In a spreadsheet, reference
SUM() instead of typing 100, which Microsoft’s
SUMPRODUCT documentation
pairs it with for this reason.
Recompute the column from the bottom row upward. Reversing direction breaks the pattern that let the first error through.
Convert to decimals and redo it. 16.00 plus 30.33 plus 28.44 gives 74.78, matching exactly.
Two routes to one number is the cheapest verification available. The Excel and Google Sheets guide shows how to run both in adjacent cells.
Yes. Rubric points, unit counts, credit hours and dollar values all exceed 100 routinely. Our warehouse example uses weights of 50, 75 and 125 totalling 250, and returns a perfectly valid 92.30. The formula divides by whatever the weights total, so the size of that total never matters. Only dividing by the wrong number does.
Yes, and this is the most common case people worry about. Weights of 20, 30 and 40 total 90 and work without modification, returning 74.78. A shortfall only signals a problem when the weight column is supposed to describe a complete allocation, such as a course syllabus or a portfolio. Otherwise it is just the scale you happened to use.
Nothing, provided you divide by the actual total. The risk is dividing by 100 out of habit, which produced 67.30 instead of 74.78 in our example, a 7.48 point error with no warning attached. Always add the weight column and use that figure as your denominator rather than assuming what it should be.
No. Decimal weights summing to 1 are convenient because the final division leaves the weighted sum unchanged, which is why portfolio allocations and probability models use them. But weights of 2, 3 and 5 totalling 10, or 50, 75 and 125 totalling 250, return identical results. The denominator adapts to whatever you give it.
Usually not. Normalising is optional arithmetic that changes how weights read without changing what they do. It helps when you want to communicate each item’s share, since 44.44% is clearer than a raw 40. It hurts when you forget you already did it and divide by the total a second time, which turns 74.78 into 0.83.
Yes, exactly. Both describe the same relative weighting, so both produce the same weighted average. With values of 96.5, 88 and 93.2, weights of 2, 3 and 5 give 923 over 10, while 20%, 30% and 50% give 9,230 over 100. Both equal 92.30. Multiplying an entire weight column by any positive number leaves the result untouched.
Find the missing assessment before calculating anything. A syllabus is supposed to cover the whole course, so a total of 94% usually means a category was omitted from your notes rather than from the course. If work genuinely remains ungraded, divide by the weight completed so far to get an honest running grade instead of a depressed final one.
Yes, and often you should. Units, hours, credits, respondents and dollar amounts all work directly as weights. Keeping the original units makes the column verifiable against an invoice, a transcript or a stock count, which a rescaled percentage column no longer is. The total will be whatever it is, and that is fine.
No weighted average exists. Division by zero is undefined, so a spreadsheet returns #DIV/0! and a
calculator returns an error or a blank. This is the one weight total that genuinely fails. In
practice it usually means the weights were entered as text rather than numbers, so check the column
formatting before assuming the data is wrong.
Back to those three routes. The answer was 74.78 the whole time, and the only thing standing between the team and it was a denominator nobody had checked. Add the weight column, write the total down, and divide by that. More questions about weighting are answered case by case, and the weighted average calculator prints the total weight beside every result so the denominator is never a guess. What does your weight column actually add up to?
Multiply each holding's return by its share of portfolio value, then add. Formula, worked example, contributions, asset classes and the measures it is not.
portfolioinvestment returnsweighted average
Divide total cost of goods available by total units available. Formula, COGS and ending inventory examples, periodic vs perpetual, FIFO compared.
inventoryweighted average costcogs
Calculate Weighted Average Online
The weighted average calculator multiplies each value by its weight, adds the weighted sum, divides by the total of weights, and prints the weighted average beside the standard arithmetic mean. Course grades, GPA, portfolio returns, and probability distributions all run through the same 4 steps.
Open the Weighted Average Calculator