What Is a Weighted Average and When Should You Use It?
A weighted average lets some values count more than others. What it means, how it differs from a simple average, and exactly when to use each one.
weighted averagesimple averagewhen to use
A weighted average lets some values count more than others. What it means, how it differs from a simple average, and exactly when to use each one.
weighted averagesimple averagewhen to use
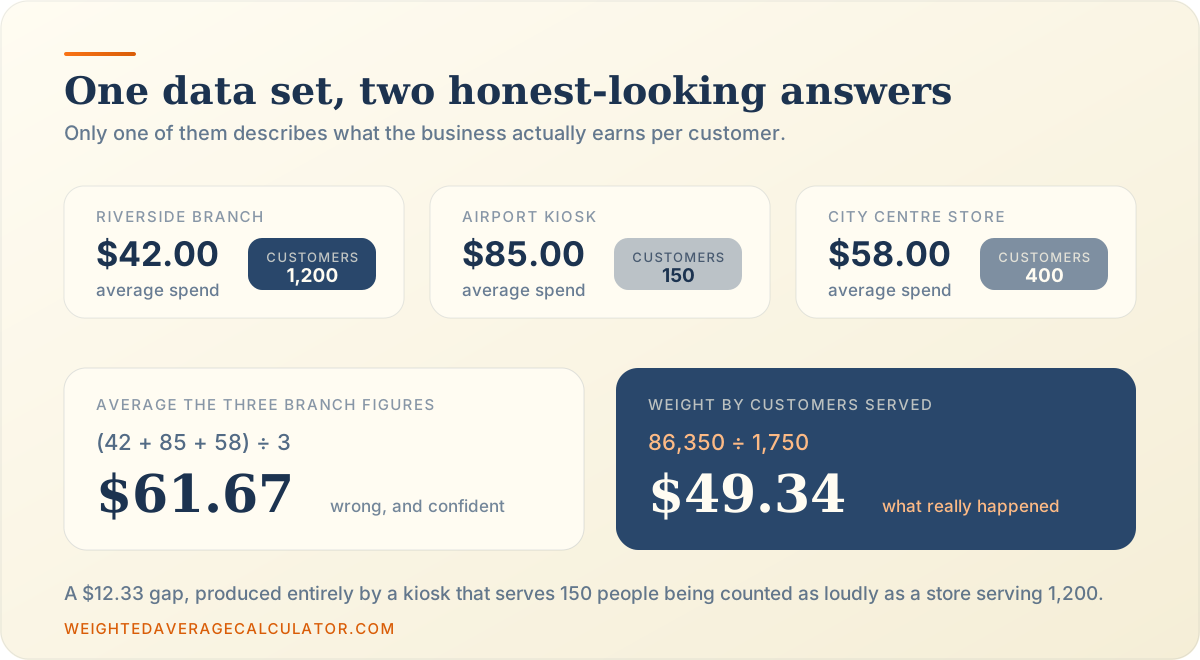
A retail chain reports average spend per customer of $61.67. The real figure is $49.34. Nobody lied, nobody fat-fingered a spreadsheet. Someone averaged three branch averages and forgot that one branch serves eight times as many people as another.
That $12.33 gap is what this article is about. Not the arithmetic, which takes thirty seconds, but the judgement call before it. When does your data need weights, and when do weights only add noise?
You will get a plain definition, a side-by-side comparison, five fields where weighting is standard practice, three honest limitations, and an interactive test for your own numbers. For the mechanics instead, the guide on how to calculate a weighted average covers the steps, and the weighted average calculator does the work.
A weighted average is an average that lets some values count more than others. Each value carries a weight describing how much influence it should have. The result leans toward the values with the heaviest weights, which is usually a far more honest summary than treating everything as equal.
A regular average, properly the arithmetic mean, gives every value the same vote. It is quick, familiar, and correct only when the values genuinely deserve equal standing.
Weighting hands out votes of different sizes. One value might get half the ballot while another gets a twentieth. You still add and you still divide. The influence each number carries is now something you control rather than something you inherit.
A weight answers one question: how much of this answer should this value own? It is a claim about influence, expressed as a number.
Weights arrive in units that feel unrelated until you look closely. Credit hours. Dollars invested. Litres purchased. Customers served. Every one says the same thing, which is “this row represents more of what we are measuring than that row does.”
Because the world is lumpy. Your portfolio holdings do not contain equal money, and your support team does not resolve every ticket type at the same frequency.
Refusing to weight is not neutral. It actively declares everything equal, and that declaration is usually false. The weighted mean calculator exists because the falsehood shows up constantly in real data.
Each value is multiplied by its weight, the products are added into a weighted sum, and that sum is divided by the total of all weights. Values with larger weights contribute more to the sum, so they pull the final answer toward themselves.
Every calculation is a set of pairs. One value, one weight, same row, never separated. An apartment scoring 9 on price with a weight of 45 is a single fact, not two numbers.
Keeping pairs intact is most of the discipline. Sort a spreadsheet by one column without the other and the relationship that made the calculation meaningful is gone.
A weight of 45 out of 100 means that value writes 45 percent of the answer alone. Raise it to 70 and the other rows become footnotes.
Here is the part worth internalising. The answer always moves toward whichever value holds the most weight, and it can never escape the range of your original values. High weight pulls harder. It never pushes past the edges.
The calculation collapses into the simple average. Exactly, every time, with no rounding drift. Weights of 10, 10 and 10 give the same answer as no weights at all.
That is a useful property. The simple average is not a rival tool. It is the special case where you have decided every value deserves identical standing.
The formula divides the sum of every value times its weight by the sum of the weights. The numerator captures influence, the denominator converts it back to the original scale, and the quotient is the weighted average.
The top half multiplies and adds. On its own that number is meaningless, because the size of your weights inflates it.
The bottom half adds the weight column alone, measuring how much influence you handed out. Dividing one by the other returns you to the scale your values were measured in.
Because otherwise the answer depends on the size of your weights rather than their balance. Weights of 1, 2 and 1 describe the same balance as 100, 200 and 100, and both must produce the same result.
Think of it as a currency conversion. Raw weights come in whatever denomination you chose. The division turns them into shares of the whole, and shares govern the outcome.
No, and believing otherwise causes real errors. Percentages reaching 100 are convenient, nothing more. Customer counts totalling 1,750 and dollars totalling $100,000 work without modification.
Only one total genuinely breaks, and that is zero. Nothing can be divided by it, so no answer exists. Every other total is fine.
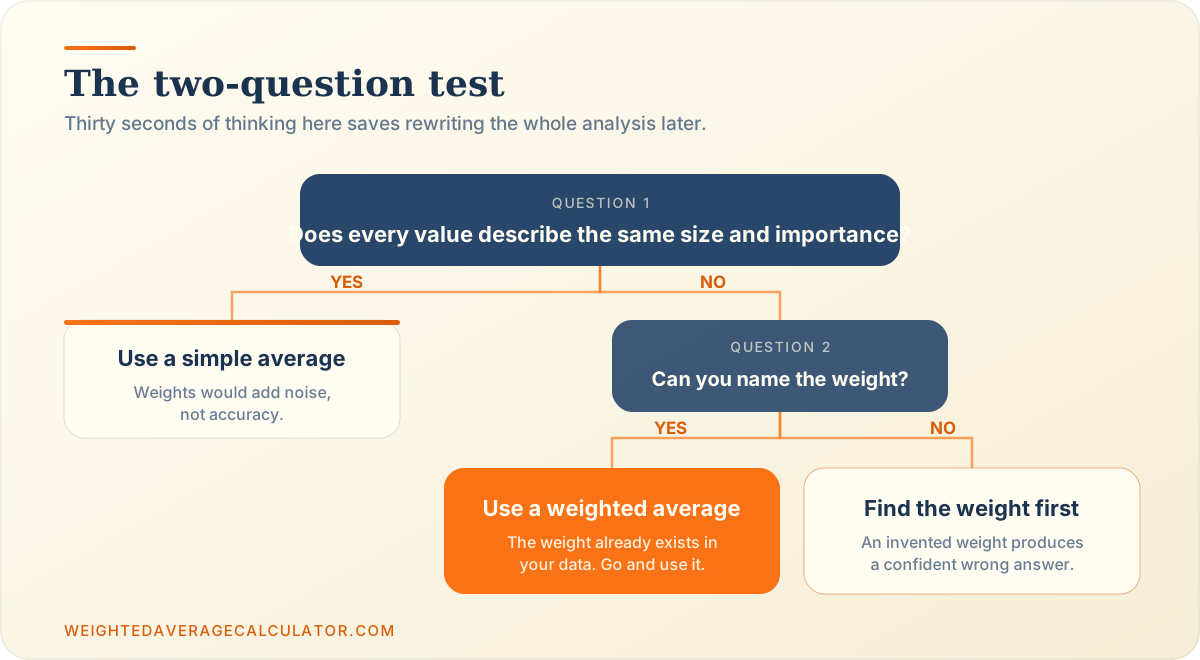
Use a weighted average whenever your values differ in importance, quantity, frequency or sample size. If you can name a reason one value should count more than another, and point to where that reason lives in your data, you need weights.
Nothing ticked yet. With no reason to weight anything, adding the values and dividing by how many there are gives an honest answer.
The case people recognise instantly. A syllabus stating 50 percent final exam, a hiring scorecard, a vendor review. Importance was decided before the data arrived.
Consider three apartment scores: commute 6, price 9, space 4. Unweighted, that averages 6.33. Weight them 35, 45 and 20 to match what you actually care about and the verdict rises to 6.95. No score moved.
Buy fuel at $3.40 for 12 gallons, $4.10 for 30 gallons and $3.75 for 18 gallons. The average price you paid is not $3.75.
| Fill-up | Price per gallon | Gallons | Amount paid |
|---|---|---|---|
| February | $3.40 | 12 | $40.80 |
| June | $4.10 | 30 | $123.00 |
| November | $3.75 | 18 | $67.50 |
| Totals | — | 60 | $231.30 |
231.30 ÷ 60 = $3.86 per gallon
Eleven cents a gallon sounds trivial. Across a fleet buying 40,000 gallons a year it is $4,400 of budget sitting somewhere the plain average never looked. The weighted average cost calculator handles this for inventory, and the weighted average inventory calculator extends it to stock valuation.
A support team resolves tickets in 1, 4 or 12 hours depending on complexity. Averaging those three numbers gives 5.67 hours, which would embarrass any team that reported it.
Count how often each happens. 240 tickets at 1 hour, 80 at 4 hours, 30 at 12 hours. The weighted answer is 2.63 hours, because fast tickets dominate. The simple average described a team that does not exist.
The trap from the opening, and it deserves a warning label. Averaging group averages without accounting for group size is one of the most common errors in business reporting.
$42 × 1200 = $50400 —
$85 × 150 = $12750 —
$58 × 400 = $23200 —
The naive figure overstates spend per customer by $12.33.
Drag any slider to zero. The mean of the branch means barely flinches, because it never knew how many customers sat behind each figure. That indifference is the whole problem.
Use a simple average when every value carries the same importance, represents the same quantity, and comes from the same kind of observation. In those cases weights add complexity and invite error without improving accuracy at all.
Daily temperature readings from one sensor. Lap times from one runner. Nothing about Tuesday makes it more important than Thursday. Adding weights here means inventing them, and invented weights are worse than none.
Ten students sitting one identical exam produce ten equally sized observations. The same holds for twelve identical production runs.
The test is simple. If you swapped any two rows, would anything change? If not, the observations are interchangeable and a simple average is correct.
Sometimes you look for a weight and find nothing defensible. That is a legitimate answer, not a failure. Reaching for one anyway, because weighting sounds rigorous, is how weak analysis gets a veneer of sophistication.
A simple average divides influence equally among the values. A weighted average divides it in proportion to the weights. They agree only when every weight is identical, and they can differ enormously when weights are unbalanced.
A simple average asks how many values there are. Weighting asks how much each value represents. That is the whole philosophical difference, and it explains every numerical one that follows.
Weights do not change any value. They change how much of the answer each value is allowed to own.
A portfolio shows this best. Three holdings returned 12 percent, negative 3 percent and 7 percent last year.
| Holding | Return | Amount invested | Return × amount |
|---|---|---|---|
| Index fund | 12% | $60,000 | $720,000 |
| Bond fund | −3% | $30,000 | −$90,000 |
| Small-cap fund | 7% | $10,000 | $70,000 |
| Totals | — | $100,000 | $700,000 |
700,000 ÷ 100,000 = 7.00%
The simple average of 12, negative 3 and 7 is 5.33 percent. The money-weighted return is 7.00 percent, because the best performer held the most capital. Report the wrong one and the portfolio is understated by 1.67 points.
Weighted averages run course grades, portfolio returns, blended prices, national statistics and business scorecards. In each field the value and the weight change, but the reasoning is identical.
Without weighting A one-point quiz would count as much as a final exam worth half the course.
A 3-credit elective and a 12-credit thesis are not the same event.
Without weighting A $500 position would sway the reported return as much as a $50,000 one.
Returns of 12%, -3% and 7% average to 5.33% unweighted, 7.00% weighted.
Without weighting A tiny top-up order would count as much as a full pallet.
Fuel at $3.40, $4.10 and $3.75 blends to $3.86, not $3.75.
Without weighting A 40-person sample would carry the same voice as a 4,000-person one.
National statistics agencies weight almost every published average.
Without weighting A vanity metric would outrank the one the business is judged on.
Scorecards fail more often through bad weights than bad scores.
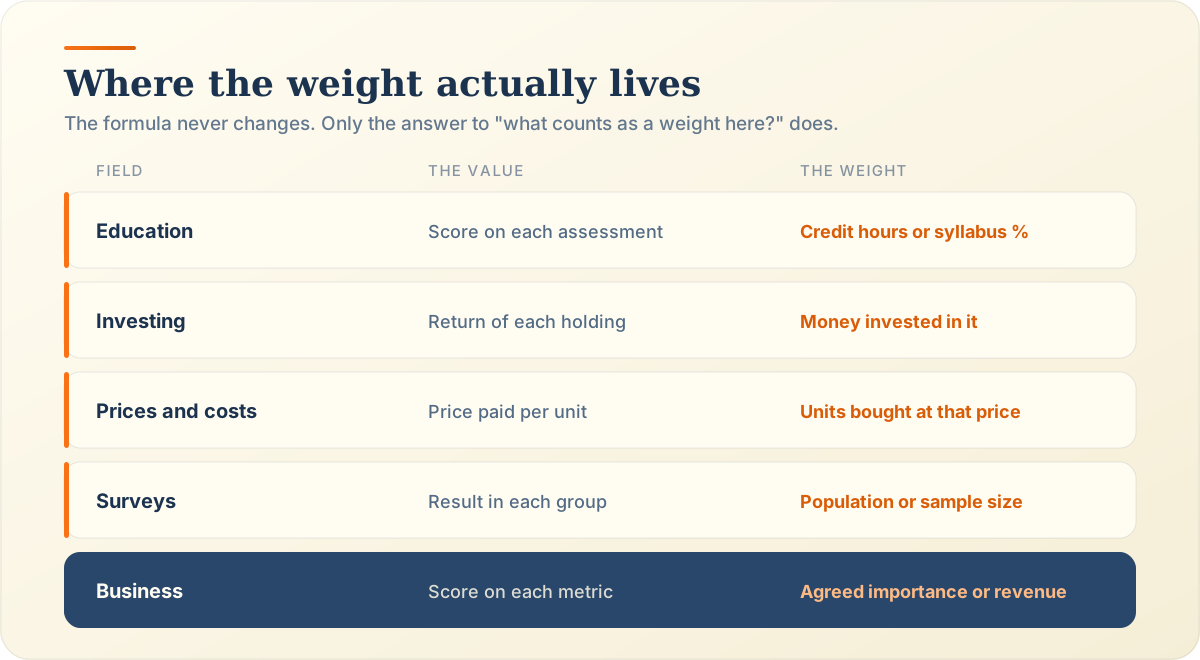
Every transcript is one of these. Credit hours weight each module, so a 12-credit thesis outranks a 3-credit elective four to one. That is also why weighted vs unweighted GPA yields two numbers from one transcript. Use the weighted grade calculator for syllabus percentages and the weighted GPA calculator for credit scales.
Money invested is the weight. A 40 percent gain on a $200 position rescues nothing. Traders apply the same logic to execution prices using share volume, which the VWAP calculator computes. Lenders use balances, handled by the weighted average interest rate calculator. Federal student loan consolidation uses this exact method, documented by Federal Student Aid.
Units bought become the weight. This covers blended fuel costs, average purchase price, and inventory valuation under weighted average costing, one of the accounting methods permitted alongside FIFO.
Population size becomes the weight. The Consumer Price Index blends price changes across a basket of goods, weighted by how much households actually spend on each. The Bureau of Labor Statistics publishes that methodology in detail, and it is worth reading once.
Revenue, headcount or agreed priority become the weight. Scorecards, service level reporting and customer satisfaction indexes all rely on weighting, and all of them fail loudly when the weights are chosen carelessly.
Pick weights from one of three sources: agreed importance, measured quantity, or relative size. Each is defensible because each already exists in your data or your agreement. Any weight that comes from somewhere else is a guess.
Use when a person or document decided what matters. Syllabus percentages, contract scorecards, priorities agreed in a meeting. The requirement is that someone can defend the number out loud.
Use when the weight can be counted. Units, hours, customers, respondents, occurrences. These are the easiest weights to justify because nobody has to argue about them.
Use when the weight measures magnitude. Dollars invested, population, square metres, loan balance. This family drives most financial and statistical weighting.
A wrong weight never produces an obviously wrong answer. It produces a plausible one, which is far more dangerous. Nobody questions a vendor score of 8.19 until they learn one criterion wrote most of it. Run the numbers through the weighted percentage calculator and read the share column before publishing.
Weighted averages describe uneven data accurately and match how decisions are actually made. They also depend entirely on the quality of the weights, which are frequently subjective and rarely audited.
Two analysts weighting the same data differently reach different conclusions, and both are arithmetically correct. That is uncomfortable and it is honest. The method is not the disagreement. The weights are.
Publish your weights beside your result. Every credible statistical agency does, and the weighted average in Excel and Google Sheets guide shows how to keep that column visible in a shared file.
A weighted average misleads when the weights are invented, when one weight dominates everything else, or when the weight does not describe the thing being measured. The arithmetic stays perfect while the conclusion goes wrong.
Weights chosen to produce a desired answer are not analysis. They are decoration. If you cannot say where a weight came from, you cannot defend the result it produced.
At 80 percent weight, brand recognition wrote 88 percent of that 8.19. The other three criteria were theatre. A score claiming to summarise four things while reporting one is worse than no score.
Weighting customer satisfaction by revenue sounds sophisticated. It answers a different question, because your unhappiest customers are often your smallest. The weight must describe what you are measuring, not something adjacent to it.
Its purpose is to summarise uneven data honestly. When values differ in importance, quantity or frequency, a number that treats them equally misrepresents what happened. Weighting lets each value contribute in proportion to what it represents, which is why grades, portfolio returns and national price indexes all use it.
A simple average divides the total by the number of values, giving each an equal vote. The weighted version multiplies each value by a weight first, then divides by the total of those weights. One asks how many values exist, the other asks how much each represents. They agree only when every weight is the same.
Use one whenever you can name a reason some values should count more. Different importance, quantities, frequencies or sample sizes all qualify. The clearest signal is averaging numbers that are already averages, such as branch or regional figures. That case almost always demands weighting by the underlying counts.
Yes, more often than people expect. When every weight is equal the two methods agree exactly. Weights of 5, 5 and 5 produce the same answer as no weights at all. That makes the simple average a special case rather than a rival method, and it gives you a quick way to sanity-check any calculator.
No. Weights can total 1, 60, 120, 1,750 or any positive number. Dividing by the total converts whatever scale you used into proportions, so percentages hold no special power. The only total that fails is zero. Credit hours, customer counts and dollar amounts all work perfectly well.
Any numeric data with a defensible measure of importance behind it. Scores, prices, rates, marks, returns, times and satisfaction ratings all weight cleanly. The weight must be non-negative and must describe the value on its own row. Labels cannot be weighted directly, though the counts within each category can.
Look for the weight before inventing one. Ask whether an agreement already sets importance, whether something countable exists, or whether the rows differ in size. Syllabuses, invoices and transcripts usually contain it already. If none of the three applies, treat that as a signal the values may deserve equal standing.
Each tool below runs the same formula with a different weight column, and each shows the weighted sum and total weight so you can audit it.
Back to that retail chain. The fix took one afternoon and changed nothing about the underlying business. It changed only which number went on the slide. More questions about weighting are answered case by case, and the weighted average calculator prints every intermediate figure so you can show your working. What is the most misleading average anyone has handed you?
Divide by whatever the weights actually total, not by 100. Worked examples above and below 100, normalising, and when a wrong total is a real warning.
weightsnormalizationweighted average
Multiply each holding's return by its share of portfolio value, then add. Formula, worked example, contributions, asset classes and the measures it is not.
portfolioinvestment returnsweighted average
Calculate Weighted Average Online
The weighted average calculator multiplies each value by its weight, adds the weighted sum, divides by the total of weights, and prints the weighted average beside the standard arithmetic mean. Course grades, GPA, portfolio returns, and probability distributions all run through the same 4 steps.
Open the Weighted Average Calculator