How to Calculate Weighted Average Cost for Inventory
Divide total cost of goods available by total units available. Formula, COGS and ending inventory examples, periodic vs perpetual, FIFO compared.
inventoryweighted average costcogs
Divide total cost of goods available by total units available. Formula, COGS and ending inventory examples, periodic vs perpetual, FIFO compared.
inventoryweighted average costcogs
A workshop buys the same cordless drill three times in one year, at $18, $21 and $24. Ask what a drill costs and the honest answer is $21.30, not the $21.00 you get by averaging three price tags.
The difference is quantity. Two hundred units came in at $18 and five hundred at $21, so the cheap lot and the mid lot are not equal partners. Get this wrong and both your profit and your balance sheet inherit the error.
This guide works one inventory scenario all the way through: the cost per unit, cost of goods sold, ending inventory, periodic against perpetual, and how the answer compares to FIFO and LIFO. The weighted average cost calculator and the weighted average inventory calculator run these numbers for you, and the weighted average calculator handles the general case.
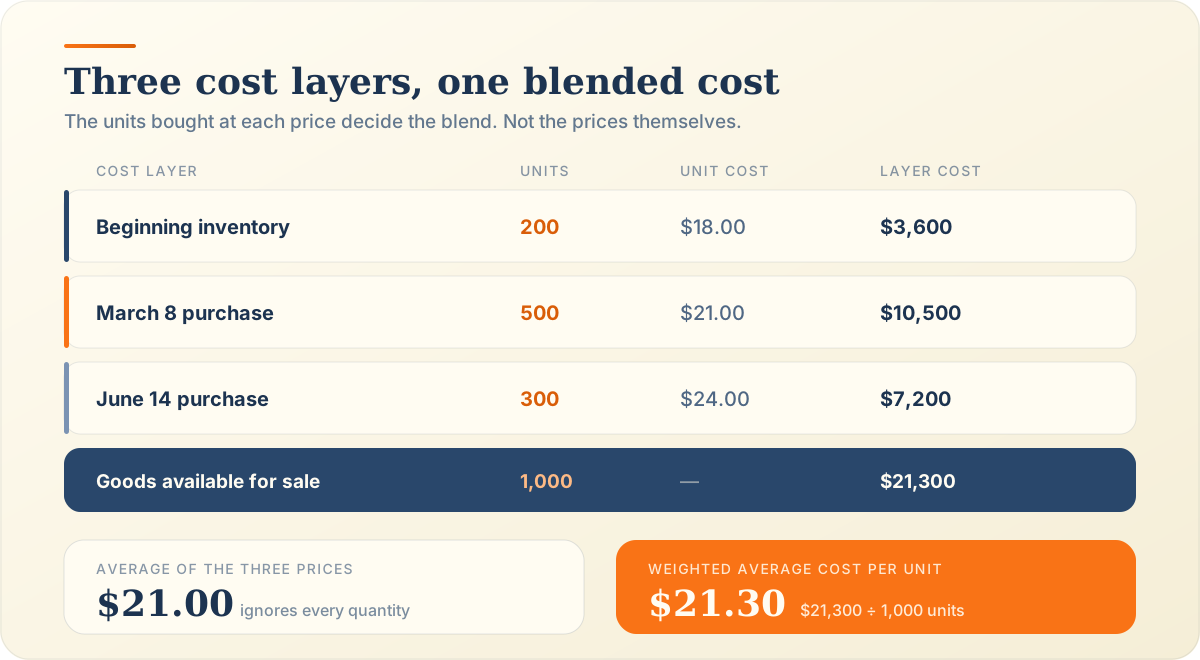
Weighted average cost assigns every unit in stock the same blended cost, calculated by dividing the total cost of goods available for sale by the total units available. No unit is treated as older or newer than another.
Pool every unit you could have sold, pool every dollar you paid for them, then divide. That single figure costs every sale and values everything left on the shelf.
Because a 500-unit purchase affects your real cost far more than a 50-unit top-up. Averaging price tags pretends the two orders were the same size.
It suits interchangeable goods where one unit is genuinely indistinguishable from the next. Fuel, screws, grain, raw chemicals, commodity components. IAS 2 Inventories permits it alongside FIFO for exactly those cases.
Weighted average cost per unit equals total cost of goods available for sale divided by total units available for sale. Both halves include beginning inventory plus every purchase made during the period.
Beginning inventory at cost plus every purchase at cost. Here that is $3,600 plus $10,500 plus $7,200, giving $21,300.
The same rows counted in units instead of dollars. 200 plus 500 plus 300 gives 1,000 units.
$21,300 ÷ 1,000 units = $21.30 per unit
Start with beginning inventory, add every purchase, total the cost column, total the unit column, then divide cost by units. Five steps, and the fourth is the one people skip.
Pull the closing figure from last period, in both units and dollars. Our workshop opened with 200 units carried at $18.00, worth $3,600.
List each purchase as its own row with its own unit cost. Freight and duty belong in these costs, which is where many first attempts quietly go wrong.
Add the dollar column. Beginning inventory belongs in this total, not beside it.
Add the unit column separately. Check it against your stock count before going further, because a wrong denominator poisons everything downstream.
Divide total cost by total units. Carry four decimal places internally and round only when you report.
Averaging the three sticker prices gives $21.00. Weighting by quantity gives $21.30, because the 500-unit March lot carries half the units on the floor.
Beginning inventory of 200 units at $18.00 plus purchases of 500 at $21.00 and 300 at $24.00 gives 1,000 units costing $21,300. The weighted average cost is $21.30 per unit.
| Cost layer | Units | Unit cost | Layer cost |
|---|---|---|---|
| Beginning inventory | 200 | $18.00 | $3,600 |
| March 8 purchase | 500 | $21.00 | $10,500 |
| June 14 purchase | 300 | $24.00 | $7,200 |
| Goods available for sale | 1,000 | — | $21,300 |
$21,300 across 1,000 units. Both totals come from the same three rows, which is why a missing purchase breaks them together rather than separately.
$21,300 divided by 1,000 gives $21.30. Note that it sits above the $21.00 price average, because 800 of the 1,000 units cost more than $18.00.
Every unit now costs $21.30, whichever lot it physically came from. That is the method’s central claim, and the reason it only suits interchangeable goods.
Multiply units sold by the weighted average cost per unit. With 700 units sold at $21.30, cost of goods sold is $14,910. No lot tracking is required because every unit carries the same cost.
Units sold equals goods available minus units remaining. Our workshop ended with 300 units, so it sold 700.
One multiplication. The same $21.30 costs the first unit sold in March and the last one sold in November.
COGS equals units sold times weighted average cost per unit. That is the entire formula.
700 units × $21.30 = $14,910
Multiply units remaining by the same weighted average cost per unit. With 300 units left at $21.30, ending inventory is $6,390, and it must add back to goods available alongside cost of goods sold.
Count them, do not derive them. A physical count that disagrees with your records is information, not an inconvenience.
The same $21.30 again. Using a different rate for the balance sheet than the income statement is a reconciliation failure waiting to happen.
Ending inventory equals units remaining times weighted average cost per unit.
300 units × $21.30 = $6,390 → $14,910 + $6,390 = $21,300
Under a periodic system, one average is calculated for the whole period. Under a perpetual system, a moving average is recalculated as purchases occur. Identical transactions can therefore produce different cost of goods sold.
Wait until the period closes, pool everything, divide once. Simple to run, and it cannot tell you your margin in July.
Recalculate the average the moment new stock arrives, then charge sales at whatever the current average is. Every modern inventory system does this automatically.
Recalculates at every purchase. Three different averages were in force during the year.
Recalculates once, after the last transaction. One average of $21.30 covers the whole year.
Because timing matters. The perpetual system charged March’s sale at $20.14, before the expensive June stock existed. The periodic system retroactively lets June raise the cost of a March sale.
One average of $21.30 covers the whole period. With 700 units sold, cost of goods sold is $14,910 and ending inventory is $6,390. The two total $21,300, the goods available for sale.
1,000 units costing $21,300, exactly as calculated above. Nothing about the sales pattern changes this total.
$21,300 divided by 1,000 gives $21.30. Calculated once, after the last transaction of the year.
700 units times $21.30 gives $14,910, charged to the income statement.
300 units times $21.30 gives $6,390, carried on the balance sheet.
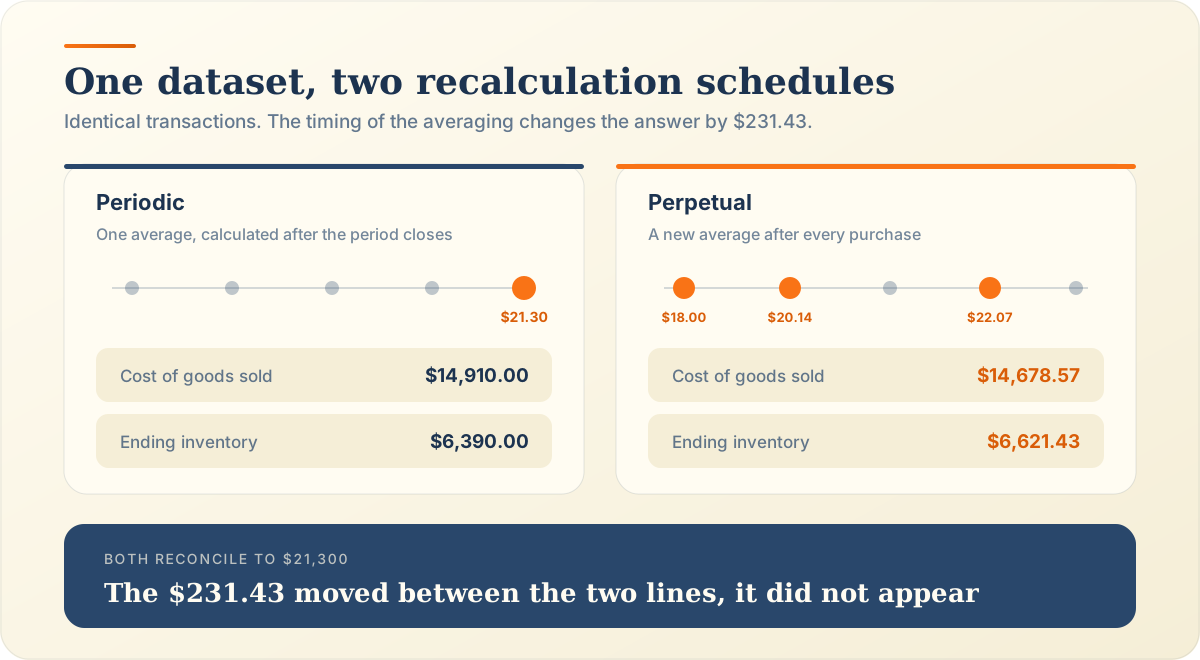
The average is recalculated after each purchase. Sales are charged at the average in force that day, producing cost of goods sold of $14,678.57 and ending inventory of $6,621.43 from the same transactions.
Opening balance of 200 units at $18.00. Until something arrives or leaves, that is the average.
The March purchase lifts the balance to 700 units and $14,100, so the average becomes $20.1429.
Opening balance of 200 units carried in at $18.00 each.
Each sale reduces both units and value by the average rate, leaving the average itself unchanged. Only purchases move it. That property confuses people and is worth reading twice.
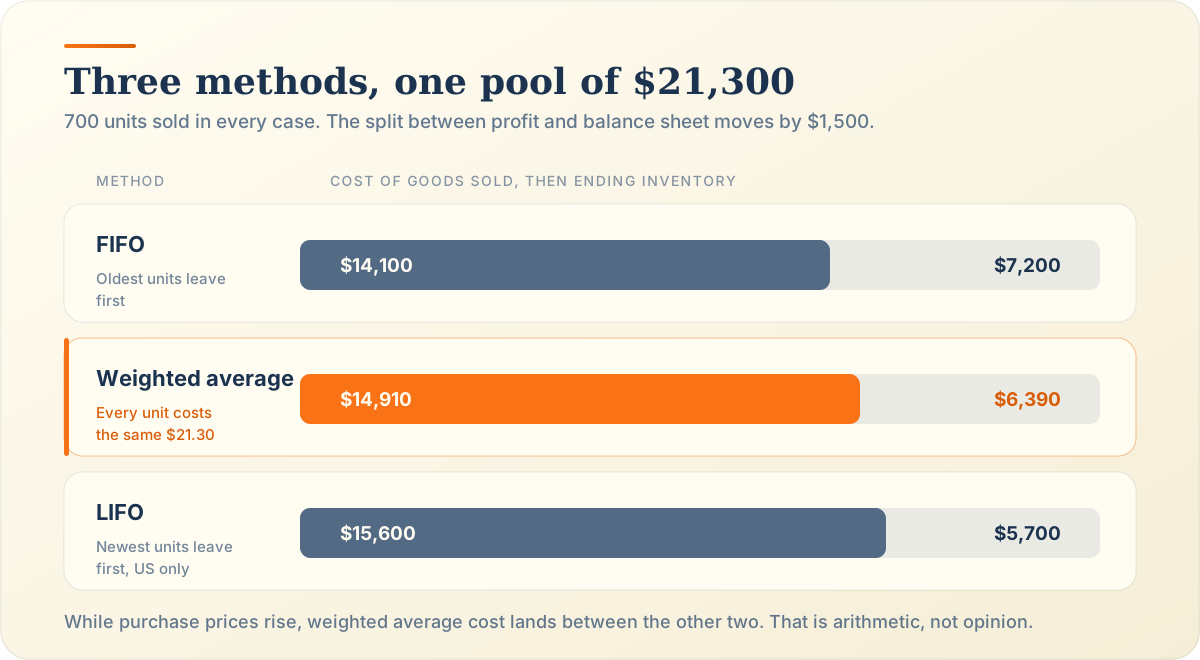
On identical data, FIFO reports the lowest cost of goods sold, LIFO the highest, and weighted average cost lands between them. All three reconcile to the same $21,300 of goods available for sale.
The oldest units leave first, so the 200 cheapest units at $18.00 go out before anything else.
Lowest COGS, highest ending inventory, highest reported profit while prices rise.
Reconciliation: $14,100.00 plus $7,200.00 equals $21,300.00, the goods available for sale. Every method must land here.
No unit is older than another. Every unit carries the same blended $21.30 cost.
Sits between the other two, by construction rather than by coincidence.
Reconciliation: $14,910.00 plus $6,390.00 equals $21,300.00, the goods available for sale. Every method must land here.
The newest units leave first, so the 300 expensive units at $24.00 go out immediately.
Highest COGS, lowest ending inventory. Permitted in the US, prohibited under IFRS.
Reconciliation: $15,600.00 plus $5,700.00 equals $21,300.00, the goods available for sale. Every method must land here.
FIFO sells the oldest units first, so the $18.00 lot leaves before anything else. COGS of $14,100 against our $14,910, and $810 more profit reported on the same sales.
LIFO sells the newest units first, giving COGS of $15,600. It is permitted under United States tax rules but prohibited under IFRS, which is why it barely exists outside the US.
FIFO and LIFO track cost layers and care which unit moved. Weighted average cost refuses to distinguish them at all, which is precisely why it needs no lot tracking.
The method is simple, smooths volatile purchase prices and needs no lot tracking. It also hides genuine cost differences, struggles with highly variable prices, and depends entirely on accurate quantities.
One rate covers everything. No lot numbers, no layers, no arguments about which pallet shipped.
A single expensive order does not spike reported margin the way FIFO or LIFO can.
When units are genuinely identical, pretending to track them individually is bookkeeping theatre.
Our $18 and $24 lots both report as $21.30. A buyer who negotiated hard gets no visible credit for it.
Current inventory guidance commonly notes that weighted average cost smooths price fluctuations, while highly variable purchase prices can make the method less representative of individual inventory batches.
The denominator is a physical count. If the count is wrong, so is every downstream figure, as what a weighted average is explains in other contexts.
Six mistakes cause most wrong answers: dividing by purchase count, omitting beginning inventory, using price instead of total cost, applying the wrong average to sales, mixing the two systems, and rounding too early.
Dividing $21,300 by three purchases gives $7,100, which is not a unit cost on any planet. The denominator is units.
Omitting the opening 200 units gives $17,700 over 800 units, or $22.13. That overstates cost of goods sold by more than $580.
Averaging $18, $21 and $24 gives $21.00 rather than $21.30. The gap is small here and large whenever lot sizes diverge, as weighted average vs simple average shows across other fields.
Under a perpetual system, charging a March sale at the December average is a real and common error. Use the average in force on the transaction date.
Pick one system and stay in it for the whole period. Half a ledger of each reconciles to nothing.
Rounding $20.142857 to $20.14 before multiplying by 400 units costs you $1.14 immediately. Round at the end, never in the middle.
Verify total units against a physical count, verify total cost against purchase records, recompute the cost per unit, and confirm that cost of goods sold plus ending inventory equals goods available for sale.
Compare 1,000 units against your stock records and receiving documents. A mismatch means a delivery is missing or duplicated.
Tie $21,300 back to supplier invoices, including freight. Ledger balances that disagree with invoices are worth chasing before anything else.
Recompute $21,300 divided by 1,000 independently. The weighted mean calculator and the weighted percentage calculator both print the two totals separately for this kind of check.
$14,910 plus $6,390 equals $21,300. If your two figures do not add back to goods available, stop and rebuild rather than adjusting one of them.
Small residuals are normal under a perpetual system. Anything above a few cents means you rounded a rate rather than a result. Spreadsheet users should see the Excel and Google Sheets guide for keeping full precision in a live file.
It is an inventory costing method that assigns every unit the same blended cost. You divide the total cost of goods available for sale by the total units available, then use that one rate for both cost of goods sold and ending inventory. It suits interchangeable goods and is permitted under both IFRS and US GAAP.
Weighted average cost per unit equals total cost of goods available for sale divided by total units available for sale. Both halves include beginning inventory plus all purchases in the period. In our example that is $21,300 divided by 1,000 units, giving $21.30. Freight and duty belong inside the cost figure.
Add the cost of beginning inventory to the cost of every purchase, add the units the same way, then divide. $3,600 plus $10,500 plus $7,200 gives $21,300 across 200 plus 500 plus 300 units. Dividing returns $21.30. Keep four decimal places while you work and round only in the final report.
Multiply units sold by the weighted average cost per unit. Selling 700 units at $21.30 gives cost of goods sold of $14,910. Under a perpetual system you instead use the average in force on each sale date, which produced $14,678.57 from the same transactions. Both approaches are legitimate, but they are not interchangeable mid-period.
Multiply the units still on hand by the same cost per unit. Our 300 remaining units at $21.30 give $6,390. The reliable check is that cost of goods sold plus ending inventory must equal goods available for sale, so $14,910 plus $6,390 returns exactly $21,300.
Periodic calculates one average after the period closes. Perpetual recalculates a moving average every time stock arrives, then charges sales at the current rate. Our data gives $14,910 of cost of goods sold under periodic and $14,678.57 under perpetual, a $231.43 difference caused purely by timing rather than by any error.
Moving average cost is the perpetual version of weighted average cost, so the terms overlap without being identical. When someone says weighted average cost without qualification they usually mean the periodic single-average calculation. Inventory software almost always implements the moving average, which is worth confirming before you reconcile anything by hand.
FIFO assumes the oldest units sell first and tracks cost layers. Weighted average cost blends every unit into one rate and tracks nothing. On our rising prices, FIFO reported $14,100 of cost of goods sold against $14,910 under weighted average, so FIFO showed $810 more profit and a higher closing inventory value from the same physical stock.
Yes, and price movement is exactly why it exists. The method absorbs each new purchase price into a blended rate, which smooths the volatility that FIFO and LIFO pass straight through to margin. The caution is that very large swings make the single rate less representative of any actual batch you hold.
Yes, and always in opposite directions. Goods available for sale is fixed at $21,300, so every dollar you do not charge to cost of goods sold stays on the balance sheet. That is why switching methods changes reported profit and inventory value simultaneously, and why accounting standards require you to apply one method consistently.
That workshop now costs every drill at $21.30 and reconciles to the penny. The fix was not clever accounting. It was counting units before averaging prices. More questions about weighting are answered case by case, the weighted average calculator prints the weighted sum and total weight side by side, and how to calculate a weighted average covers the same arithmetic outside the stock room. Which layer is hiding in your closing count?
Divide by whatever the weights actually total, not by 100. Worked examples above and below 100, normalising, and when a wrong total is a real warning.
weightsnormalizationweighted average
Multiply each holding's return by its share of portfolio value, then add. Formula, worked example, contributions, asset classes and the measures it is not.
portfolioinvestment returnsweighted average
Calculate Weighted Average Online
The weighted average calculator multiplies each value by its weight, adds the weighted sum, divides by the total of weights, and prints the weighted average beside the standard arithmetic mean. Course grades, GPA, portfolio returns, and probability distributions all run through the same 4 steps.
Open the Weighted Average Calculator