Weighted Average vs. Simple Average: The Difference
A simple average gives every value one vote. A weighted average sizes each vote. Both formulas, worked examples, and how to pick the right one.
weighted averagesimple averagecomparison
A simple average gives every value one vote. A weighted average sizes each vote. Both formulas, worked examples, and how to pick the right one.
weighted averagesimple averagecomparison
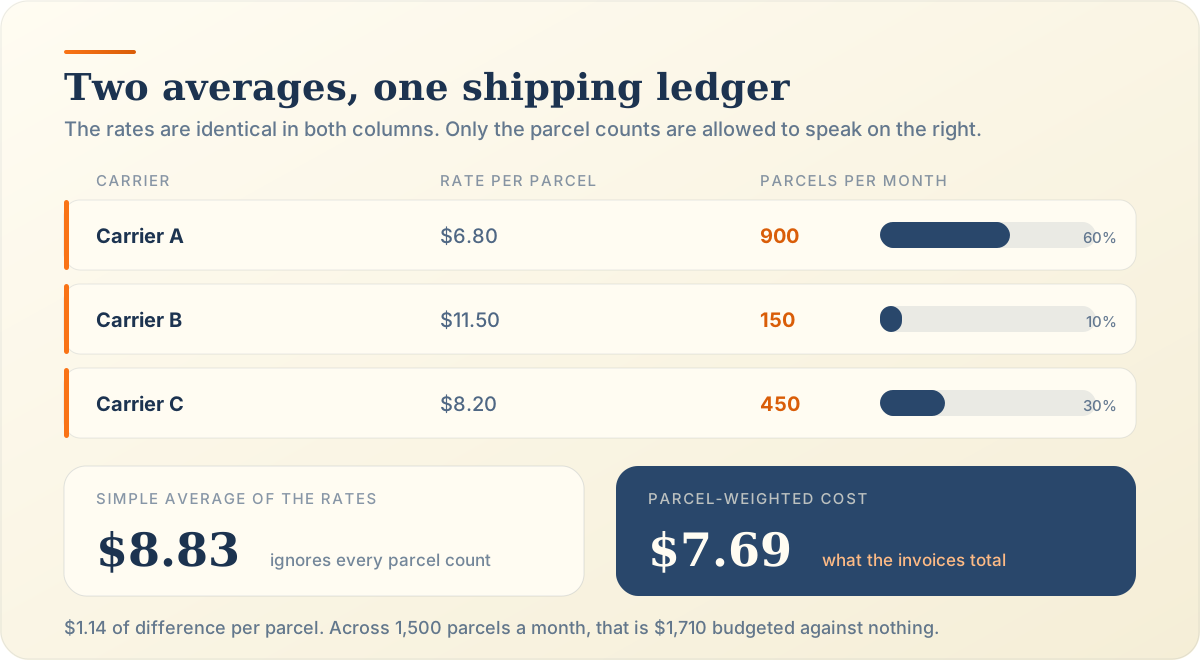
A logistics team budgets shipping at $8.83 per parcel. The invoices arrive at $7.69. Nobody miscalculated anything. Someone averaged three carrier rates without noticing that one carrier handles 900 parcels a month and another handles 150.
Two averages. Same three numbers. A $1.14 difference on every parcel, which is $1,710 a month sitting in the wrong column of a forecast.
This is a head-to-head comparison, not a tutorial. You will get both formulas side by side, the four differences that actually matter, a worked example run twice, and the one property that proves these are not rival methods at all. For the concept on its own, read what a weighted average is. To run your own numbers, the weighted average calculator prints both figures together.
A simple average, or arithmetic mean, adds every value and divides by how many values there are. Each value counts exactly once. It is the average almost everyone learned first, and it is correct whenever the values genuinely deserve equal standing.
Add the numbers. Divide by the count. For carrier rates of $6.80, $11.50 and $8.20, that is $26.50 divided by 3, which gives $8.83. No other information enters the calculation, and that is the whole design.
Every value owns exactly one third of a three-value answer. Not approximately. Exactly. The rate used on 150 parcels holds precisely as much power over the result as the rate used on 900.
That equality is not an accident of the method. It is an assertion the method makes on your behalf, whether or not you agree with it.
When the values are interchangeable. Ten students sitting one identical paper. Twelve identical production runs. Daily readings from a single sensor. Nothing distinguishes one observation from another, so nothing needs to.
A weighted average multiplies each value by a weight, adds those products, then divides by the total of the weights. Values with heavier weights contribute more, so the answer leans toward whatever your data says actually matters.
One extra column, one extra multiplication per row, one different denominator. For the same three carriers weighted by parcels, the products total $11,535 and the parcels total 1,500, giving $7.69. The weighted mean calculator shows both totals separately so you can see where the shift came from.
A weight states how much of the answer a value should own. Parcels shipped. Credit hours. Dollars invested. Survey respondents. The unit varies wildly, and the role never does.
Crucially, the weight is not a second value. Confusing the two is the single most common way this calculation goes wrong.
Whenever you can point at a column and say “this row represents more than that one.” Different volumes, different importance, different group sizes. If that column exists, ignoring it is a choice with consequences.
The two methods differ in how they treat values, in their formula, in their denominator, and in which row moves the answer. Only the last difference changes your conclusions. The other three are the machinery that produces it.
A simple average treats values as a list of equals. A weighted average treats them as a set of claims, each staking a different share of the outcome. Same numbers, completely different assumptions about what those numbers represent.
The simple version has no multiplication step at all. The weighted version multiplies before it adds. That single extra operation is the entire structural difference between the two.
This is where people trip. The simple average divides by the count of values, which was 3. The weighted average divides by the sum of the weights, which was 1,500. Dividing a weighted sum by the row count produces nonsense, and it happens constantly in hand-built spreadsheets.
owns 33.3% of the answer 900 parcels
owns 33.3% of the answer 150 parcels
owns 33.3% of the answer 450 parcels
Every rate counts once, so the rarely used Carrier B rate carries the same voice as the carrier moving 900 parcels.
Flip the switch above and watch the bars. The rates never move. Carrier A goes from owning 33.3 percent of the answer to owning 60 percent, and the answer drops $1.14 because of it. Influence is the thing weights control, and influence is the thing that changes your decisions.
The simple average formula is the sum of the values divided by n. The weighted average formula is the sum of value times weight, divided by the sum of the weights. The second reduces to the first whenever every weight is 1.
Sum of x divided by n. The n counts rows. It carries no information about the rows themselves, which is precisely why the formula is so short.
Sum of w times x, divided by sum of w. The numerator is the weighted sum. The denominator is the total weight. Both totals are worth printing separately, because a wrong answer usually reveals itself in one of them rather than in the final figure.
Set every weight to 1 and the weighted formula collapses. Multiplying by 1 leaves the values untouched, so the numerator becomes a plain sum. Adding 1 once per row gives the row count, so the denominator becomes n. What you are left with is the simple average, character for character.
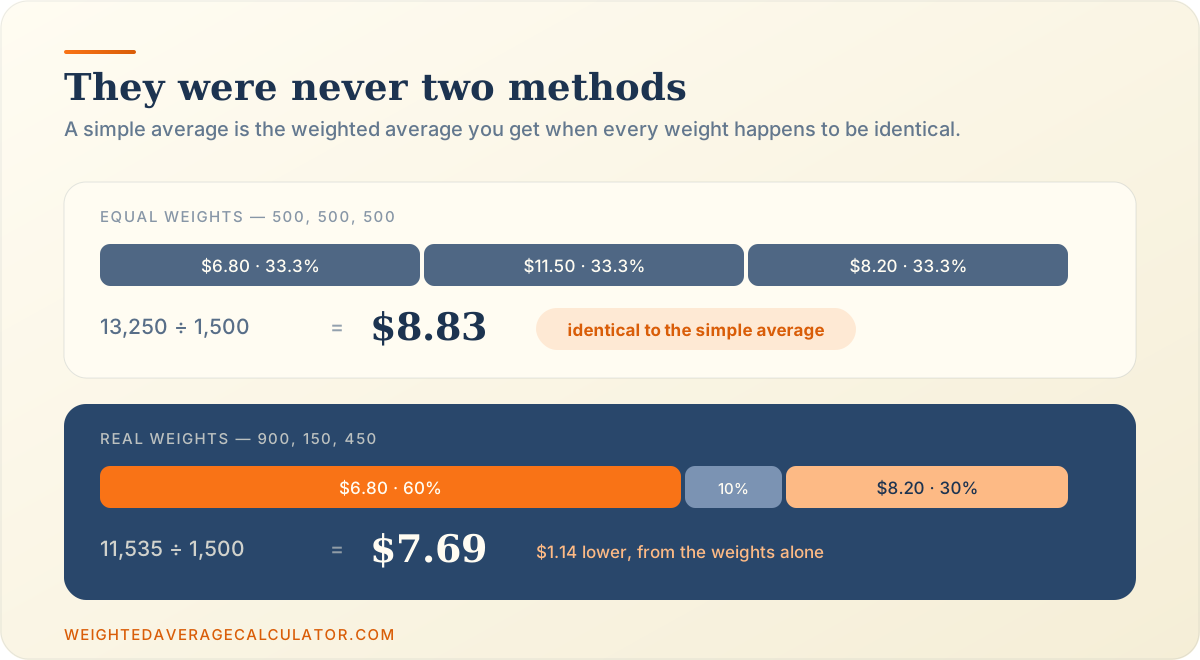
Run the same three carrier rates twice. With equal parcel volumes both methods return $8.83. With the real volumes of 900, 150 and 450, the weighted answer falls to $7.69 while the simple average never moves.
Give each carrier exactly 500 parcels and the weights stop distinguishing anything.
(6.80 × 500) + (11.50 × 500) + (8.20 × 500) = 13,250 → 13,250 ÷ 1,500 = $8.83
Now use the real volumes.
| Carrier | Rate per parcel | Parcels | Rate × parcels |
|---|---|---|---|
| Carrier A | $6.80 | 900 | $6,120.00 |
| Carrier B | $11.50 | 150 | $1,725.00 |
| Carrier C | $8.20 | 450 | $3,690.00 |
| Totals | — | 1,500 | $11,535.00 |
11,535 ÷ 1,500 = $7.69 per parcel
Because Carrier B is expensive and rare. At $11.50 it drags the simple average upward while representing only one parcel in ten. The weighted version puts it back in proportion, which is the entire job. A weighted percentage calculator makes those shares visible row by row.
Use a simple average when every observation counts equally, represents the same amount, and has no meaningful weighting factor attached. In those situations weights add complexity and risk without adding a single point of accuracy.
Test scores from one sitting of one paper. Lap times from one runner. Rainfall from one gauge. The equality is real, so the method that assumes it is correct.
Fifty single-unit sales. Twenty identical service calls. Each row stands for exactly one of the same thing, so the row count is already a perfectly good denominator.
Sometimes you go looking for a weight and find nothing you could defend. Stop there. Inventing a weight to seem rigorous is worse than admitting the data is flat, because the invented number carries false authority into every downstream decision.
Use a weighted average when values differ in importance, quantity, group size, or the share of a total they represent. Any one of those four conditions is enough on its own to make the simple average misleading.
A syllabus setting a lab report at 15 percent and the exam at 60 percent has already done your weighting for you. Ignoring it converts a carefully designed assessment into a flat one, which is why the weighted grade calculator exists at all.
Prices across different volumes. Rates across different balances. Costs across different order sizes. The shipping example is this category, and so is inventory costing, handled by the weighted average cost calculator.
A morning shift of 30 workers averaging 96 units per hour and a night shift of 6 averaging 78 do not combine into 87. They combine into 93, because 30 workers outvote 6. This is the classic case, and the Stanford Encyclopedia of Philosophy entry on Simpson’s paradox shows how far the reasoning can be pushed.
Marketing returns of 6.2x, 2.8x and 1.4x look like a 3.47x average. Weight them by the 10, 65 and 25 percent of budget each channel consumed and the real figure is 2.79x. Proportions of a total are always weights, even when nobody labels them that way.
The weighted average becomes the simple average exactly. Not approximately, not usually. This makes the simple average a special case of the weighted average rather than a competing technique.
When every weight is the same number, it factors out of both the numerator and the denominator and cancels. Whether that shared weight is 1, 500 or 8,000 makes no difference to the result. The OpenStax statistics text develops the same point formally.
Every weight is 500, so the weighted average lands exactly on the simple average. The two markers are sitting on top of each other.
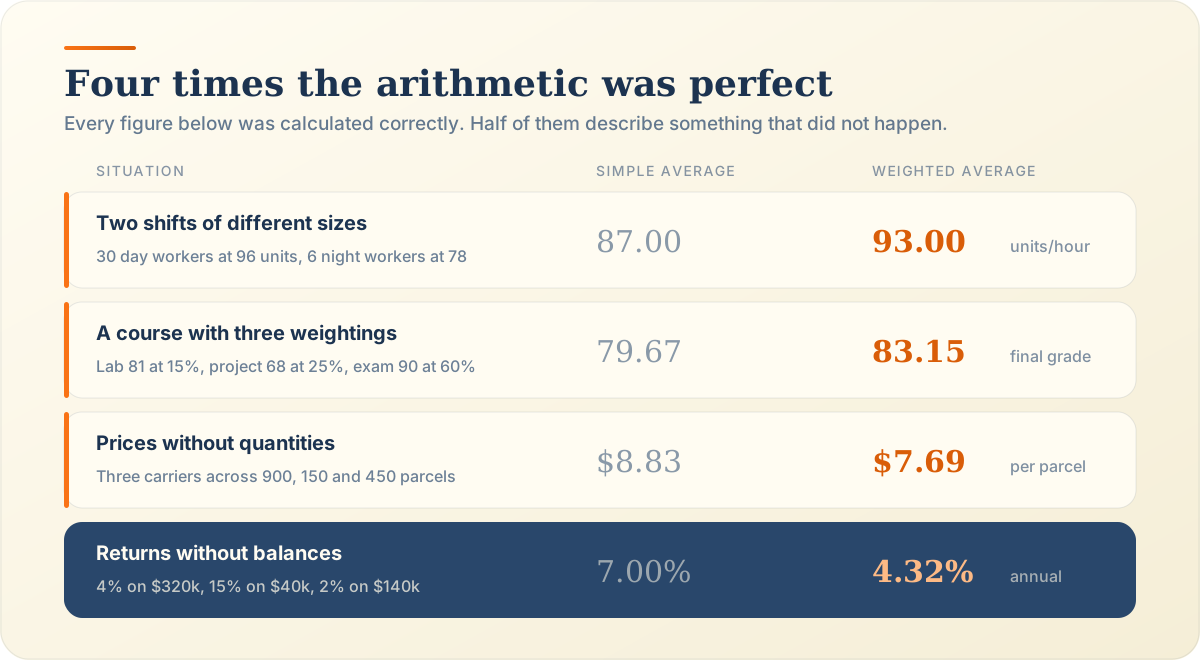
The wrong average misleads most often in four places: averaging group averages, averaging grades with different course weights, averaging prices without quantities, and averaging returns without balances. All four produce numbers that look entirely reasonable.
A morning shift of 30 workers averages 96 units per hour. A night shift of 6 workers averages 78.
The plant looks 6 units per hour slower than it is, because 6 night workers were counted as loudly as 30 day workers.
A lab report scores 81 at 15%, a group project 68 at 25%, and the written exam 90 at 60%.
A 3.48 point swing, which is the difference between two letter grades at most institutions.
Rates of $6.80, $11.50 and $8.20 across 900, 150 and 450 parcels a month.
Budgeting from $8.83 overstates monthly shipping by $1,710 on the same 1,500 parcels.
Property returns 4% on $320,000, an equity fund 15% on $40,000, cash savings 2% on $140,000.
The portfolio looks 2.68 points stronger than it is, entirely because of a $40,000 holding.
The most damaging of the four, because the output looks authoritative. Regional averages, team averages, branch averages. Any time you average numbers that are already averages, you need the underlying counts.
A lab report at 81, a group project at 68 and an exam at 90 average to 79.67 if you ignore weights, and 83.15 if you do not. That gap spans two letter grades. The guide to calculating a weighted average of grades covers the mechanics, and credit-weighted transcripts use the weighted average mark calculator.
Our carriers again. Buying more at the cheap rate and less at the expensive one is exactly what a procurement team should do, and the simple average erases the evidence that they did it.
Property returning 4 percent on $320,000, an equity fund returning 15 percent on $40,000, and cash returning 2 percent on $140,000 average to 7.00 percent only if you ignore the money. Weighted by balance, the portfolio returned 4.32 percent. Traders hit this daily, which is why a VWAP calculator weights by share volume and the weighted average interest rate calculator weights by loan balance.
Ask three questions. Does every value have equal influence in reality? Can you name what the weights would represent? Does the data contain different group sizes or quantities? One clear yes to either of the last two settles it.
Swap any two rows in your table. If the meaning of the data is unchanged, the rows are interchangeable and a simple average is honest. If swapping them feels wrong, you already know why.
Say it out loud in one sentence. “Weighted by parcels shipped.” “Weighted by credit hours.” If you cannot finish that sentence, you do not have a weight yet, and you should not pretend otherwise.
Look for a count column. Units, people, hours, respondents, dollars. Its presence is usually the whole answer, and its absence is worth a second look before you conclude anything.
Three mistakes cause most bad averages: treating unequal values as equal, applying weights with no real basis, and averaging already-averaged data without its counts. All three survive review because the arithmetic is flawless.
The default mistake, made by omission rather than intent. Nobody decides to ignore a weight column. They simply reach for the familiar formula and never look right.
The opposite failure, and more embarrassing. Weights invented to reach a preferred conclusion produce a number with no defence. If a weight cannot be traced to a document, a count or an agreement, it is not evidence.
You can average group averages correctly, but only by weighting each one by its group size. Skipping that step is how the opening $1,710 forecast error happened, and how the shift report understated a factory by six units an hour.
Only when weights genuinely exist in the data. A weighted average built on real counts or agreed importance is more accurate. One built on invented weights is less accurate than the simple version, because it adds a fabricated assumption on top of the data. Accuracy comes from the weights being true, never from the method sounding more advanced.
Yes, and they always do when every weight is equal. Three values weighted 500, 500 and 500 give exactly the same answer as no weights at all. They can also coincide by accident when the high and low values happen to balance. That coincidence is not proof your weights are correct, so do not treat a match as validation.
Yes. Set every weight to 1 and the weighted formula reduces to the simple one exactly. The multiplication leaves values unchanged and the total weight becomes the row count. Understanding this removes the anxiety about picking a method, because you are really only deciding whether your weights are all equal or not.
Whenever values differ in importance, quantity, frequency or group size. The clearest trigger is averaging numbers that are already averages, such as branch or regional results. A second reliable trigger is the presence of a count column beside your values. If you can name what the weight represents in one sentence, use it.
Yes, provided you know each group’s size. Multiply every group average by its group size, add the products, then divide by the total size. That reconstructs the correct overall figure exactly. What you cannot do is average the group averages directly, unless every group happens to be the same size.
Nothing interesting, which is the point. The shared weight cancels out of the numerator and the denominator, leaving the simple average. Weights of 1, 7 or 900 all behave identically as long as every row carries the same one. This makes an equal-weight run a useful sanity check on any calculator you have not used before.
Every tool below runs the weighted formula and shows the weighted sum beside the total weight, so you can compare it against the simple average yourself.
That logistics team now budgets at $7.69 and reconciles to the penny. The fix was not a better formula. It was noticing that a parcel count column had been sitting in the same spreadsheet the whole time. More questions about the two methods are answered case by case, the weighted average calculator reports both figures together, and the Excel and Google Sheets guide shows how to keep them side by side in a live file. Which column has been hiding in your data?
Divide by whatever the weights actually total, not by 100. Worked examples above and below 100, normalising, and when a wrong total is a real warning.
weightsnormalizationweighted average
Multiply each holding's return by its share of portfolio value, then add. Formula, worked example, contributions, asset classes and the measures it is not.
portfolioinvestment returnsweighted average
Calculate Weighted Average Online
The weighted average calculator multiplies each value by its weight, adds the weighted sum, divides by the total of weights, and prints the weighted average beside the standard arithmetic mean. Course grades, GPA, portfolio returns, and probability distributions all run through the same 4 steps.
Open the Weighted Average Calculator