

Last semester, a finance student shared her portfolio report with me. She averaged three fund returns using a simple average and reported 11.3% growth. The actual weighted return was 6.8% because her largest holding barely moved. That 4.5-point gap was not a rounding error. It was the wrong method entirely. Choosing between a weighted average calculator and a simple average is one of the most overlooked decisions in data analysis.
This guide gives you a clear framework for making that choice every time. You will learn when each method works, where each one fails, and how to recognize the difference in seconds. By the end, you will never second-guess which average to use again.
Why Choosing the Right Average Matters
The wrong average can distort results enough to change grades, misrepresent returns, and derail business decisions. This is not a minor technical detail. It shapes every conclusion you draw from data.
How the Wrong Average Can Mislead Results
A simple average of 95 and 60 gives 77.5. But if the 95 carries five times the weight, the real answer is 89.2. Anyone using 77.5 for grading or reporting would make a decision based on a number that misrepresents reality by more than 11 points. Try our weighted average calculator to see how quickly results diverge when weights differ.
Equal Importance vs Different Importance
A simple average assumes every value contributes equally. That assumption is correct when measuring identical items, like five thermometers reading room temperature. It breaks down the moment one data point matters more than another, which is most real-world data.
The Cost of Ignoring Weights
In GPA calculations, ignoring credit hours turns a 3.7 GPA into a 3.2. In portfolio analysis, it can overstate or understate returns by thousands of dollars. In survey research, it gives disproportionate voice to small sample groups. The cost compounds as data sets grow.
A Quick Real-Life Scenario
A hiring manager averages interview scores from three panels. Panel A interviewed 40 candidates, Panel B interviewed 10, and Panel C interviewed 5. A simple average treats all three panel scores equally. A weighted average reflects that Panel A's score represents eight times more candidates than Panel C. The weighted result guides the hiring policy toward the experience of the majority, not the minority.
How Wrong Averages Mislead
InteractiveAdjust the weight of Value A to see how the gap between simple and weighted averages grows:
What Is the Difference Between a Simple Average and a Weighted Average?
A simple average divides the sum of all values by their count, treating every entry equally. A weighted average multiplies each value by its importance, sums those products, and divides by total weight.
How a Simple Average Treats Data
Add all numbers together, divide by how many there are. Three test scores of 90, 80, and 70 produce (90+80+70)/3 = 80. Every score gets the same influence regardless of whether one test was a final exam and another was a pop quiz.
How a Weighted Average Treats Data
Multiply each number by its weight, then divide by total weight. If those same scores have weights of 5, 3, and 1, the calculation becomes (90x5 + 80x3 + 70x1) / (5+3+1) = 83.89. The final exam score of 90 pulls the average up because it carries more weight. The weighted grade calculator applies this exact logic to academic scores.
Key Difference at a Glance
The simple method counts items. The weighted method measures their importance. Both produce the same result only when every item matters equally.
Comparison Table
| Feature | Simple Average | Weighted Average |
|---|---|---|
| Formula | Sum / Count | Sum(Value x Weight) / Sum(Weight) |
| Data treatment | All values equal | Values weighted by importance |
| Accuracy for unequal data | Low | High |
| Inputs required | Values only | Values and weights |
| Common use | Quick estimates | GPA, finance, surveys |
| Risk of misrepresentation | High when weights differ | Minimal |
How to Decide Which Average You Should Use
Ask three questions about your data: Are all values equally important? Do some contribute more? Are you working with credits, percentages, or varying quantities? Your answers point directly to the right method.
Are All Values Equally Important?
If every data point matters the same amount, a simple average works perfectly. Five identical sensors measuring humidity, eight students taking the same quiz with equal grading weight, or three equal-sized product batches tested for quality all qualify for simple averaging.
Do Some Values Contribute More?
When a final exam counts for 50% of a grade and homework counts for 10%, those values contribute differently. The same applies to a $100,000 stock position versus a $5,000 position. Whenever contribution varies, you need weighting.
Are You Working with Credits, Percentages, or Quantities?
Credit hours, investment amounts, sample sizes, and production volumes are all natural weights. If your data includes any of these alongside values, a weighted average is almost always the correct choice. Our weighted percentage calculator handles percentage-based weights with precision.
Decision Flowchart
Average Selection Flowchart
DiagramQuick Self-Assessment Checklist
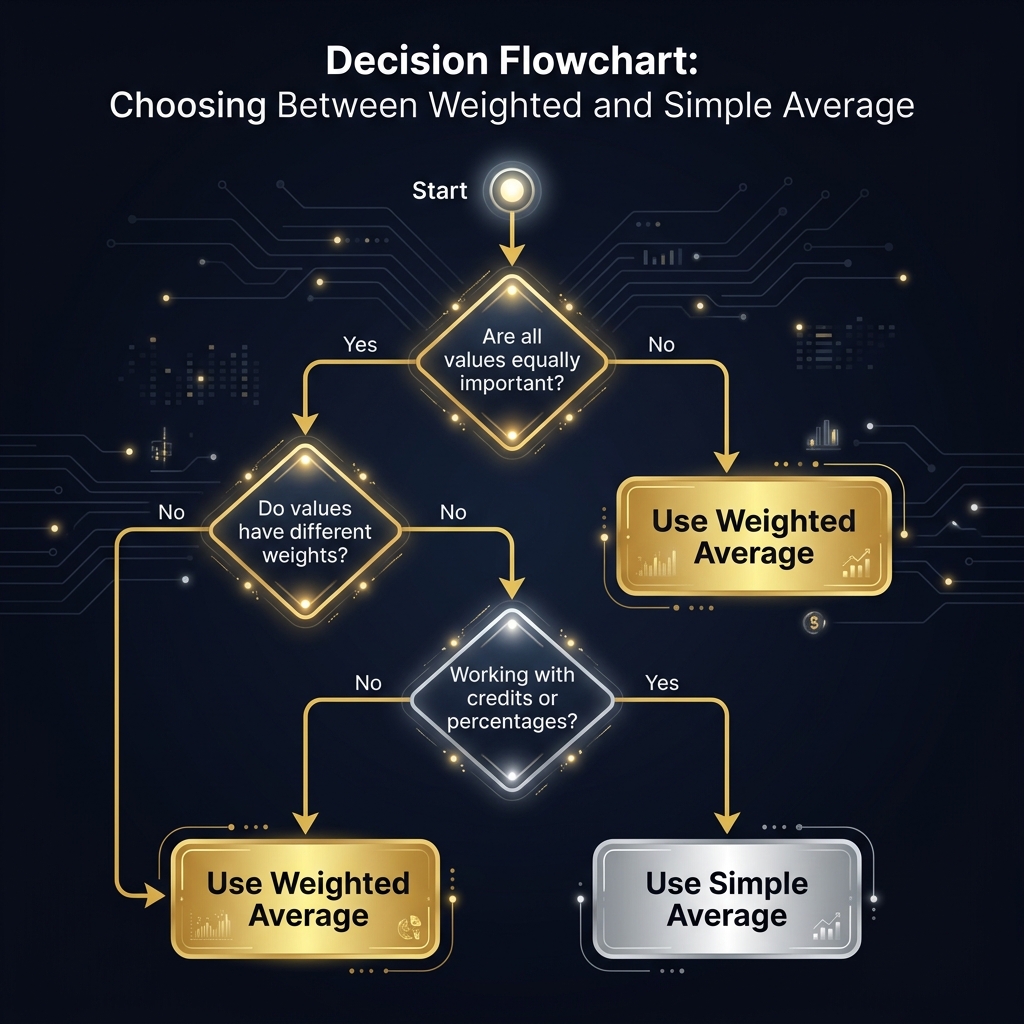
A clear decision tree helps you pick the right averaging method in seconds
Signs That You Should Use a Weighted Average Calculator
Five common data patterns signal that weighting is necessary: unequal credit hours, varying investment sizes, different sample sizes, importance-based scoring, and quantity-based pricing.
Different Credit Hours
A 4-credit course should influence your GPA four times more than a 1-credit seminar. Simple averaging treats both equally, producing a GPA that does not reflect your academic performance accurately.
Different Investment Sizes
A $200,000 real estate investment returning 4% matters far more to your net worth than a $2,000 savings account earning 5%. The weighted investment calculator ensures portfolio analysis reflects actual dollar exposure.
Unequal Sample Sizes
A customer satisfaction survey from 1,000 respondents in Region A and 50 respondents in Region B should not give both regions equal voice when computing a company-wide score. Weighting by sample size produces a representative result.
Importance-Based Scoring
Performance reviews where leadership skills count for 40% and punctuality counts for 10% demand weighting. A simple average ignores that management cares about leadership four times more.
Quantity-Based Pricing
Buying 500 units at $12 each and 50 units at $15 each produces a weighted average cost of $12.27, not $13.50. Inventory valuation relies on weighted costs to reflect actual spending.
Situations Where a Simple Average Is the Better Choice
A simple average works best when every data point genuinely carries identical importance. Forcing weights onto equal data adds complexity without improving accuracy.
Equal Data Importance
Five temperature readings from the same sensor at the same location each carry the same validity. Weighting them would imply one reading matters more, which is not true.
Small Personal Data Sets
Tracking your daily step count across a week involves seven equal days. No single day is inherently more important for a weekly summary. Simple averaging tells you your typical daily steps.
Uniform Measurements
Quality control tests on identical products from the same production line produce equally valid measurements. Each test matters the same as any other.
Basic Performance Tracking
A runner timing five identical 400-meter laps wants the average lap time. Each lap covers the same distance under the same conditions. Simple averaging is the correct choice.
Examples Where Weighting Adds No Value
Averaging the heights of three friends, the prices of four identical items from the same store, or humidity readings from three identical sensors at equal intervals. In these cases, every value is equally trustworthy and equally important. Save the weighted approach for data where importance actually varies.
Side-by-Side Scenarios: Which Average Gives the Correct Answer?
Comparing both methods on the same data reveals exactly when weighting changes the outcome and when it does not.
Live Side-by-Side Comparison
Try ItStudent Grades
Final exam (90, weight 5), midterm (78, weight 3), homework (95, weight 1). Simple: 87.67. Weighted: 85.22. The simple average overestimates because it gives homework the same influence as the final exam. For accurate grade calculation, use the weighted average calculator for grades.
Employee Performance Scores
Leadership (88, weight 4), teamwork (92, weight 2), punctuality (98, weight 1). Simple: 92.67. Weighted: 90.57. The simple average inflates the result because punctuality receives equal credit as leadership, despite being one-fourth as important in the evaluation criteria.
Product Reviews
Amazon product with 800 five-star reviews and 200 one-star reviews. Simple average of 5 and 1 is 3.0. Weighted by count: (5x800 + 1x200) / 1000 = 4.2. The weighted result correctly reflects that 80% of buyers gave five stars.
Stock Portfolio Returns
Stock A returned 12% on $80,000 invested. Stock B returned 3% on $20,000 invested. Simple: 7.5%. Weighted: 10.2%. The simple average understates your actual portfolio return by nearly 3 percentage points because it ignores position sizes.
Survey Responses
Region A scored satisfaction at 8.5 (1,200 respondents). Region B scored 6.0 (200 respondents). Simple: 7.25. Weighted: 8.14. The simple average gives Region B's small sample five times more influence than its population warrants.
Which Method Produces the More Meaningful Result?
In every scenario above where weights differed, the weighted average produced the result that more accurately reflects reality. The simple average only matched the weighted result when all weights were equal, which was never the case in these real-world examples.
Common Decision-Making Mistakes
Four recurring errors cause people to pick the wrong averaging method, often without realizing the impact until decisions are already made.
Assuming Every Number Deserves Equal Influence
The default instinct is to add and divide. Most people learned simple averages first and reach for them automatically. That instinct fails whenever data carries natural weights like credit hours, dollar amounts, or sample sizes.
Using a Simple Average for Weighted Data
Averaging fund returns without accounting for investment size is the most common mistake in personal finance. It tells you what the average fund did, not what your actual money did. The difference can be thousands of dollars annually.
Applying Weights Without a Valid Reason
Some users over-correct by weighting data that should be treated equally. Assigning arbitrary weights to equal temperature readings, for example, introduces bias where none existed. Weighting must reflect genuine, measurable differences in importance.
Confusing Frequency with Importance
A value appearing frequently is not the same as a value being important. A customer who buys once at $10,000 matters more to revenue than 100 customers buying at $5 each, even though the $5 purchases are more frequent. Frequency counts participation. Weight measures impact.
Benefits of Choosing the Correct Average
Selecting the right averaging method improves the quality of every downstream decision.
More Reliable Decisions
When your average reflects reality, every decision built on it stands on solid ground. Hiring budgets, inventory orders, and performance evaluations all improve when the underlying numbers are accurate.
Better Business Reporting
Executives need metrics that reflect organizational reality. A weighted average of division performance by revenue size tells the true story. A simple average disguises which divisions drive results.
Fairer Academic Evaluation
Students deserve grades that reflect the importance of each assignment. A weighted system ensures the final exam counts more than a pop quiz, which aligns with learning objectives. The weighted credits calculator makes credit-based GPA calculations transparent.
Improved Financial Analysis
Portfolio managers, accountants using weighted average cost methods, and bond analysts calculating weighted average maturity all need weighting for accurate financial reporting. Using simple averages in these contexts introduces quantifiable error.

Multiple industries rely on weighted averages for accurate analysis and fair decision-making
Industries That Commonly Prefer Weighted Averages
Weighted averages are standard practice in industries where data naturally carries unequal importance.
Education
Universities calculate GPA by weighting grade points by credit hours. A 4-credit A contributes four times more than a 1-credit A. Course grading systems weight exams, assignments, and participation at different percentages.
Finance
Portfolio returns, weighted average cost of capital (WACC), and bond duration calculations all require weighting by dollar amount, market value, or outstanding balance.
Accounting
The weighted average cost method values inventory by weighting each purchase price by the quantity purchased. This produces a cost per unit that reflects actual spending patterns.
Statistics
Stratified sampling weights results by stratum size. Meta-analyses weight individual studies by sample size. Both applications demand weighted averaging for valid conclusions.
Market Research
Consumer surveys weight responses by demographic representation to ensure results reflect the target population rather than the convenience sample.
Manufacturing
Production cost analysis weights unit costs by batch volume. A batch of 10,000 units at $2.10 matters more to overall cost than a batch of 100 at $2.50.
Industry Weight Examples
VisualCan a Simple Average and a Weighted Average Ever Be the Same?
Yes. Both methods produce identical results when every weight is the same value. This is the mathematical proof that a simple average is actually a special case of a weighted average.
When All Weights Are Equal
Assign weight 1 to every value. The weighted formula becomes (V1x1 + V2x1 + V3x1) / (1+1+1), which simplifies to (V1+V2+V3) / 3. That is identical to a simple average. The same holds for weight 5, weight 100, or any uniform value.
Why the Results Match
Equal weights mean equal influence. When influence is uniform, the multiplied step adds no differentiation. The weighted average degrades into a simple average mathematically, proving that simple averaging is just weighting where every weight happens to be the same.
Practical Example
Three product batches of exactly 100 units each, priced at $10, $12, and $14. Simple average: $12.00. Weighted average (each weighted by 100): (10x100 + 12x100 + 14x100) / 300 = $12.00. Identical, because batch sizes are equal.
Exceptions to Remember
The moment one batch size changes to 150 units, the results diverge. Even small weight differences produce measurable gaps in the final average. The practical takeaway: double-check whether your data truly has equal weights before defaulting to a simple average.
Decision Framework: Which Average Should You Choose?
A structured framework eliminates guesswork and ensures you pick the right method before the first calculation.
Questions to Ask Before Calculating
Start with: "Does every item in my data set represent the same amount, volume, importance, or count?" If yes, simple average. If no, or if you are not sure, investigate the weights before choosing.
Choosing the Right Method in Seconds
Look at your data columns. If you only have values, simple average. If you have values paired with credit hours, dollar amounts, sample sizes, or any measure of importance, use a weighted average. Our weighted average calculator handles the computation instantly once you identify your weights.
Decision Matrix
| Your Data Looks Like | Use This Method | Why |
|---|---|---|
| Identical measurements | Simple Average | All values are equally valid |
| Grades with credit hours | Weighted Average | Credits create natural weights |
| Returns with portfolio sizes | Weighted Average | Dollar amounts are the weights |
| Survey scores by region | Weighted Average | Respondent count varies |
| Daily step counts | Simple Average | Each day is equally important |
| Prices with purchase quantities | Weighted Average | Quantity is the weight |
Printable Reference Guide
Save this rule: if your data only has values, average them simply. If your data has values paired with any measure of size, importance, or count, average them with weights. This two-sentence rule covers over 90% of averaging decisions you will face.
Frequently Asked Questions
When should I use a weighted average instead of a simple average?
Use a weighted average whenever data points carry different levels of importance. Examples include courses with different credit hours, investments of varying sizes, and survey groups with unequal sample counts.
Why is a weighted average more accurate?
It reflects real-world importance by giving more influence to values that matter more. A simple average treats everything equally, which distorts results when importance genuinely varies.
Can a simple average produce incorrect conclusions?
Yes. When data points have unequal importance, a simple average ignores that disparity. The resulting number does not accurately represent the true center of your data, leading to flawed decisions.
Do weighted averages always give different results?
No. When all weights are equal, both methods produce identical results. The difference only emerges when weights vary across data points.
Is a weighted average harder to calculate?
Slightly more steps are involved manually. A weighted average calculator automates the process completely, making it just as fast as a simple average for the user.
Should percentages always be weighted?
Not always. Weight percentages when the groups they represent differ in size. If all groups are equal, a simple average of percentages works correctly.
Can equal weights make a weighted average the same as a simple average?
Yes. When every weight is the same value, the weighted formula simplifies to a simple average because each value receives identical influence.
Which average is better for GPA calculations?
A weighted average is always the correct choice for GPA. Courses carry different credit hours, and a 4-credit A should influence your GPA more than a 1-credit elective.
Which average is better for investment returns?
Always use a weighted average for investment returns. Position sizes determine actual portfolio performance. A small gain on a large position matters more than a large gain on a small one.
Can businesses rely on simple averages?
Only when all business segments are equal in size. Most businesses have divisions of varying revenue or headcount, making weighted averages the more reliable choice for accurate reporting.
Conclusion
Choosing between a simple average and a weighted average is not a matter of preference. It is a matter of accuracy. Use a simple average when every data point carries equal importance. Use a weighted average the moment importance, size, count, or credit hours vary across your data.
The finance student from the opening paragraph recalculated her portfolio using our weighted average calculator. Her reported return dropped from 11.3% to the correct 6.8%. That 4.5-point correction changed her investment strategy for the next quarter. The tool took three seconds. The insight saved her months of misguided decisions.
Which data set are you averaging today? If it has natural weights, those weights deserve to be heard. Open the weighted average calculator and let your data tell its complete story.