How to Choose the Right Weights for a Weighted Average
Choosing a weight is choosing a question. How to pick importance, quantity, value or sample weights, test them, and document them so they hold up.
weightsweighting methodweighted average
Choosing a weight is choosing a question. How to pick importance, quantity, value or sample weights, test them, and document them so they hold up.
weightsweighting methodweighted average
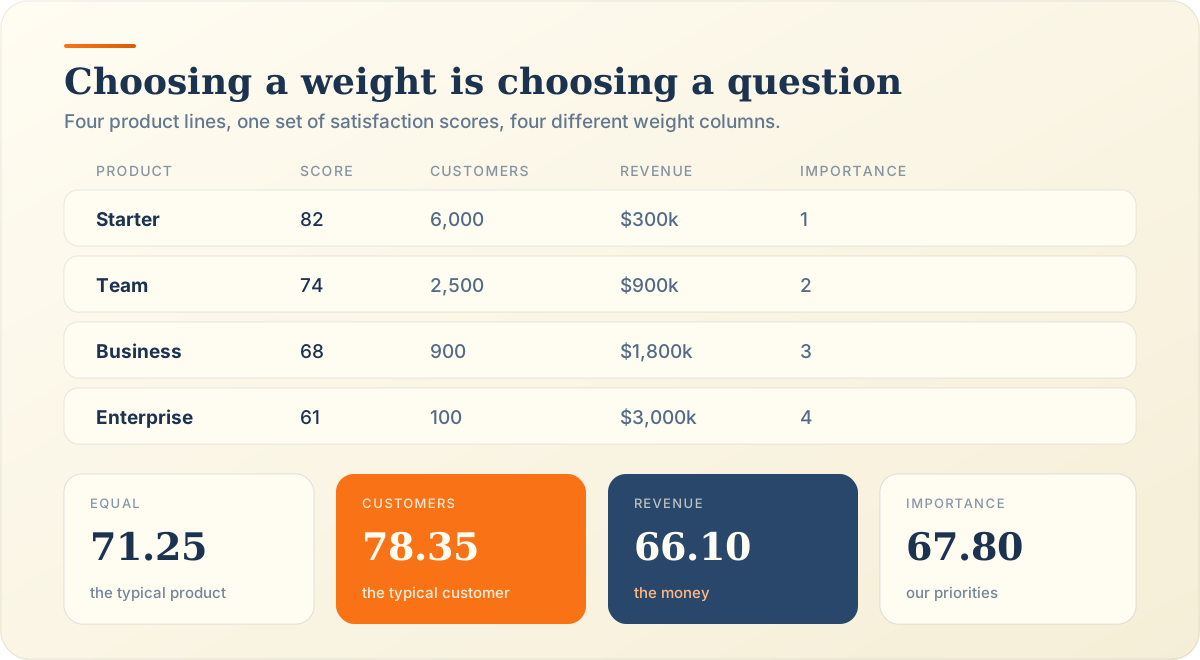
A software company scores customer satisfaction across four product lines: 82, 74, 68 and 61. Asked for one overall number, finance says 66.10, support says 78.35, and the product team says 71.25.
Nobody made an arithmetic error. Each team weighted the same scores differently and answered a different question.
The formula is easy. Choosing the weight column is the actual work. This guide covers what a weight means, how to pick one, how to test it, and how to document it. The weighted average calculator and the weighted mean calculator run the arithmetic, and what a weighted average is covers the concept itself.
A weight states how much of the answer one value should own. It can mean importance, quantity, size, sample representation or money. Naming which is the first decision.
A judgement that one value matters more, such as a final exam at 40% of a course.
A count of how often a value occurred, such as 6,000 customers on one plan.
The magnitude a value describes, such as a 4-credit course against a 1-credit one.
How much of a population a group stands for, which is how every national survey is weighted.
The money behind a value, such as $3.0 million of revenue from one product line.
Check measurable bases first: counts, money, sample sizes and time. Use importance only when none fits, and equal weights when nothing does.
Use when a person or document decided priorities in advance, and write down who decided.
Use when units, orders or people can be counted. Nobody argues about a count.
Use when values repeat, such as ratings, occurrences or observations in a frequency table.
Use when each value describes something with a measurable magnitude, usually money.
Use when averaging group results. A group of 900 outvotes a group of 100.
Use when values applied for different durations, such as rates weighted by days outstanding.
Use equal weights when every value deserves identical standing or no defensible basis exists. It is a legitimate choice, not an absence of one.
Readings from one sensor or laps from one runner. Nothing distinguishes one row from the next.
Equal is more honest than invented. A made-up weight carries false authority into every result.
Calculate the equal-weight result first. It becomes your benchmark for judging every other scheme.
Identical weights cancel out of the formula, leaving the plain average. Our four products give 71.25.
Rank the values, turn the ranking into weights, confirm them with someone accountable, and record why. Undocumented importance weights are opinions.
Start with a ranking before you pick numbers. Order is easier to agree than magnitude.
Turn the ranking into numbers. Our product team used 1, 2, 3 and 4, giving 67.80.
Ask the people accountable for the outcome. Their agreement is what makes the weight defensible.
If you cannot explain why Enterprise is worth four times Starter, the 4 is decoration.
One line per weight is enough. Future you will not remember the reasoning.
Use the count describing how much each value represents: units, occurrences or group size. Anyone can verify a count, which makes it easy to defend.
Units, litres and orders. The count already sits in your records.
How often each value occurred. A frequency table is a weighted average waiting to be calculated.
Each observation counts once, so the observation count becomes the weight for grouped results.
Weighting by customers gives 78.35, because Starter holds 6,000 of 9,500 customers.
Whenever the question is about the typical unit, person or event rather than the typical category.
Use money when the question is financial: revenue, balances, purchase cost or market value. Match the weight to the decision the result will inform.
Weighting by revenue gives 66.10, because Enterprise earns half the money and scores lowest.
Dollars invested decide a portfolio’s return, not the number of holdings.
Spend per supplier weights supplier performance by how much each one matters to the budget.
Current value, not purchase price, for anything that reprices, which is most investments.
Match the weight to the decision. Pricing decisions want revenue, and risk decisions want exposure.
Use syllabus percentages for course grades and credit hours for GPA. The institution already chose them, so your job is applying them correctly.
The syllabus sets these, and the weighted grade calculator applies them directly.
Credits weight GPA, handled by the weighted GPA calculator.
A category worth 40% should move your grade four times as far as one worth 10%.
Only when the syllabus says so. The full method is in calculating weighted grades and GPA.
Weight each holding by its share of portfolio value at the start of the period. Equal weights describe a portfolio you do not own.
Each holding’s value divided by the total gives its weight.
A large position moves the result more than a small one with a bigger return.
Use start-of-period values for a period return, and never mix the two dates.
Every return must cover the same window. One quarterly figure among annual ones breaks everything.
It assumes equal position sizes. See weighted average portfolio returns for a worked gap of 4.70 points.
Weight each price by the quantity bought at it. Purchase count is never the weight, because a 500-unit order and a 50-unit order are not equals.
Units at each price decide the blended price, which the weighted average cost calculator computes.
Total cost over total units gives cost per unit. Beginning inventory counts too.
Each batch is one row, weighted by its unit count.
Three orders are three rows, not three weights of one each.
When units are interchangeable, as weighted average cost for inventory explains.
Only when they describe a complete allocation. Counts, credits and dollars total whatever they total, and the formula divides by that automatically.
When the column claims to cover a whole, such as every assessment in a course.
Our customer weights total 9,500 and our revenue weights total 6,000. Both are correct.
Keep the original units. They stay verifiable against a source document.
Optional, and useful for showing each row’s share to a reader.
Weights of 2, 3 and 5 match 20%, 30% and 50%, because the formula divides by the total. The full treatment is in weighted average when weights do not total 100%.
Add the weights, divide each by that total, and optionally multiply by 100 to read them as percentages. The weighted average itself does not change.
Revenue weights of 300, 900, 1,800 and 3,000 total 6,000.
That gives 0.05, 0.15, 0.30 and 0.50.
Multiply by 100 to read 5%, 15%, 30% and 50%.
They must, exactly. Anything else means you divided by the wrong total.
Multiply and add, with no further division. The result stays 66.10.
Match weights to the question, use one basis, compare against equal weights, test sensitivity, and check that no single weight dominates.
Customer weights answer customer questions. Using them for a revenue decision answers the wrong one.
One basis per calculation. Customers beside revenue in one column is two questions tangled together.
The gap is what your weights add. Ours ranges from 5.15 points below to 7.10 above.
At its real revenue weight, Starter owns 5% of the answer. Push it up and see how quickly a small product line can start rewriting the headline number.
If one row writes most of the answer, the other rows are decoration.
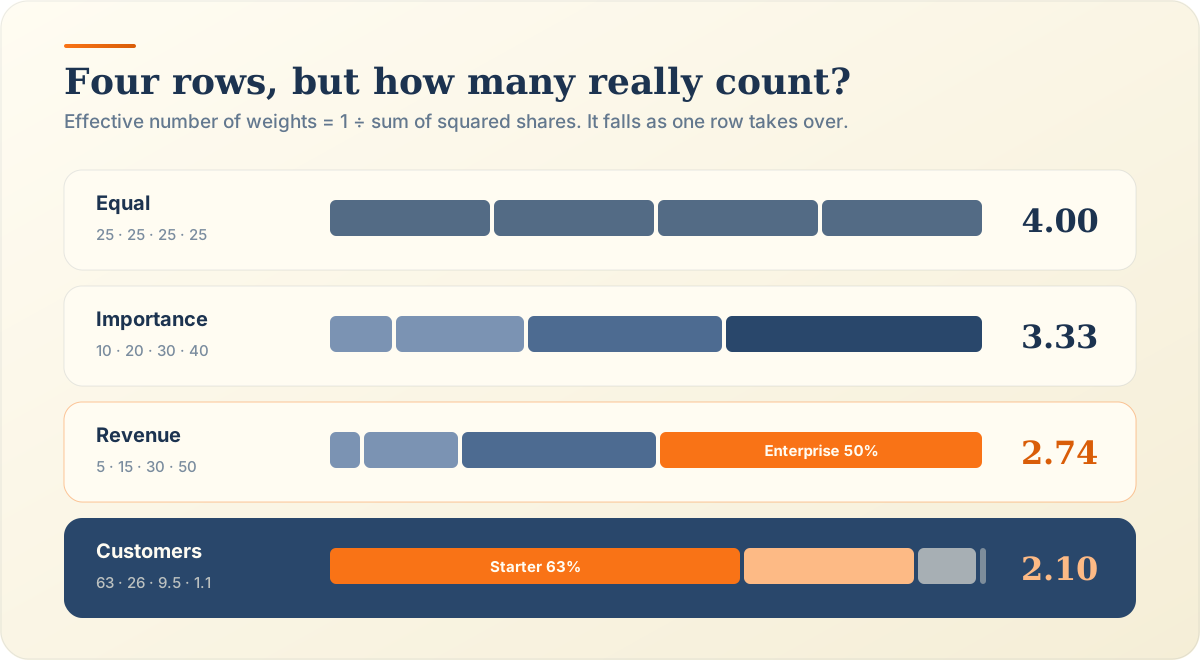
No single weight should silently control the result. Measure each share, calculate the effective number of weights, and review any row holding half the total.
Four rows, but the average behaves as if it had fewer than three. Enterprise alone holds half the weight.
At 50% of revenue weight, Enterprise ties every other product line combined.
A 1.1% customer weight barely registers. That is fine if it is true, and a problem if it hides a critical segment.
Tripling Starter’s revenue weight from 300 to 900 moves the result from 66.10 to 67.55.
Contribution is weight share times value. Rank rows by contribution, not by value.
If a reasonable alternative basis flips your conclusion, report both results rather than choosing the flattering one.
Eight mistakes cause most bad weighting, from having no basis at all to changing weights until the answer looks right.
If you cannot name the source, you invented it.
Enterprise is strategically vital and has 100 customers. Both facts are true, and they point in opposite directions.
Four product lines are not four equal voices when one holds 63% of customers.
Equal must be a decision, not a reflex, as weighted average vs simple average shows.
Customers for two rows and revenue for two rows produces a number that answers nothing.
Revenue in thousands beside revenue in dollars inflates one row a thousandfold.
Weighting satisfaction by revenue can hide the unhappiest customers, who are often the smallest.
Switching from customer to revenue weights moves our answer by 12.25 points. Picking the flattering basis after seeing both results is not analysis.
The same four scores produce 71.25 with equal weights, 78.35 weighted by customers, 66.10 weighted by revenue and 67.80 weighted by importance. Choose the basis before you see the results.
| Product line | Score | Customers | Revenue | Importance |
|---|---|---|---|---|
| Starter | 82 | 6,000 | $300k | 1 |
| Team | 74 | 2,500 | $900k | 2 |
| Business | 68 | 900 | $1,800k | 3 |
| Enterprise | 61 | 100 | $3,000k | 4 |
| Totals | — | 9,500 | $6,000k | 10 |
(82 + 74 + 68 + 61) ÷ 4 = 71.25
744,300 ÷ 9,500 customers = 78.35
396,600 ÷ $6,000k revenue = 66.10
Grade points of 3.7, 4.0 and 3.3 across 4, 1 and 3 credits give 28.7 quality points over 8 credits, a 3.59 GPA. Equal weighting would claim 3.67.
How is the typical product line doing?
Heavy weight on a high value lifts the result, and on a low value drags it down. The further from equal, the further from the simple average.
Customer weights favour Starter at 82, lifting the result to 78.35.
Revenue weights favour Enterprise at 61, dragging the result to 66.10.
Equal gives 71.25. Every unequal scheme moves away from it toward whichever value it favours.
Rows with small shares barely move the answer. Rows near 50% move it almost one for one.
A 12.25 point spread does not mean the data is unreliable. It means four different questions were asked.
Record what each weight represents, its source, how it was applied, a consistency rule and a review trigger. Five lines make it defensible.
“Revenue per product line, in thousands of dollars.” One sentence, no ambiguity.
Name the system and the date. National statistics offices publish exactly this, as the US Census Bureau’s survey methodology shows.
Write the formula you used, including what you divided by.
Same basis every period. Switching quietly makes this quarter incomparable with last quarter.
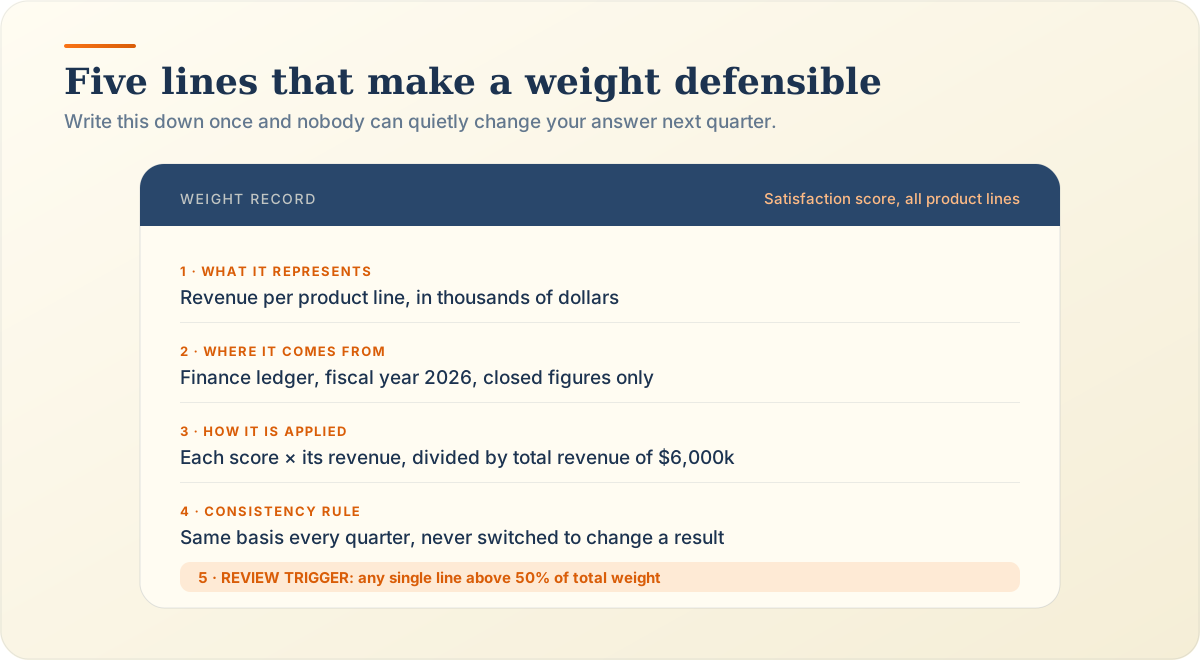
Set a trigger in advance, such as any row crossing 50% of total weight, rather than reviewing whenever a result disappoints.
Look for a measurable basis first: a count, money, a sample size or a duration. If none fits, use agreed importance weights and write down why. If nothing supports different weights, use equal ones.
Whatever describes how much each value represents for your question. Units for prices, credit hours for GPA, market value for portfolios, respondents for surveys and syllabus percentages for course grades.
Quantity for questions about typical units or people, importance for questions about priorities. Our products give 78.35 by customers and 67.80 by importance, answering different questions.
No. The formula divides by the total weight, so 9,500 customers or 6,000 in revenue work directly. A 100% total only matters when the weights claim to describe a complete allocation.
Yes, and the result equals the simple average. That is legitimate whenever every value deserves identical standing.
Yes. Frequency is among the most defensible weights, because anyone can verify a count.
Yes. Units bought, orders filled and people served all work directly. The weighted percentage calculator shows each quantity’s share of the total as you enter it.
Yes, and for portfolio returns you should. Weight each holding by its market value at the start of the period. Loan rates work the same way, which the weighted average interest rate calculator handles.
Divide each weight by the total of all weights. Revenue weights of 300, 900, 1,800 and 3,000 become 0.05, 0.15, 0.30 and 0.50. The weighted average stays exactly the same.
That value effectively becomes the answer. At 63% of customer weight, Starter pulls the result to 78.35 almost by itself. Review any scheme where one row reaches half the total weight.
Yes, and dramatically. The same four scores range from 66.10 to 78.35 across four weighting bases. That is exactly why the basis must be chosen and documented before anyone sees the results.
Confirm they match your question, use one basis, compare against equal weights, test sensitivity, and check no row holds half the total. Survey researchers at Pew Research Center test weighting schemes in exactly this way.
Back to those four product lines. All three teams were right, and the argument ended once each wrote down what its weights meant. Choose, test, document. More questions about weighting are answered case by case, and the weighted average calculator shows each row’s share so you can see which weight is doing the work. Which question is your weight column really answering?
Divide by whatever the weights actually total, not by 100. Worked examples above and below 100, normalising, and when a wrong total is a real warning.
weightsnormalizationweighted average
Multiply each holding's return by its share of portfolio value, then add. Formula, worked example, contributions, asset classes and the measures it is not.
portfolioinvestment returnsweighted average
Calculate Weighted Average Online
The weighted average calculator multiplies each value by its weight, adds the weighted sum, divides by the total of weights, and prints the weighted average beside the standard arithmetic mean. Course grades, GPA, portfolio returns, and probability distributions all run through the same 4 steps.
Open the Weighted Average Calculator