
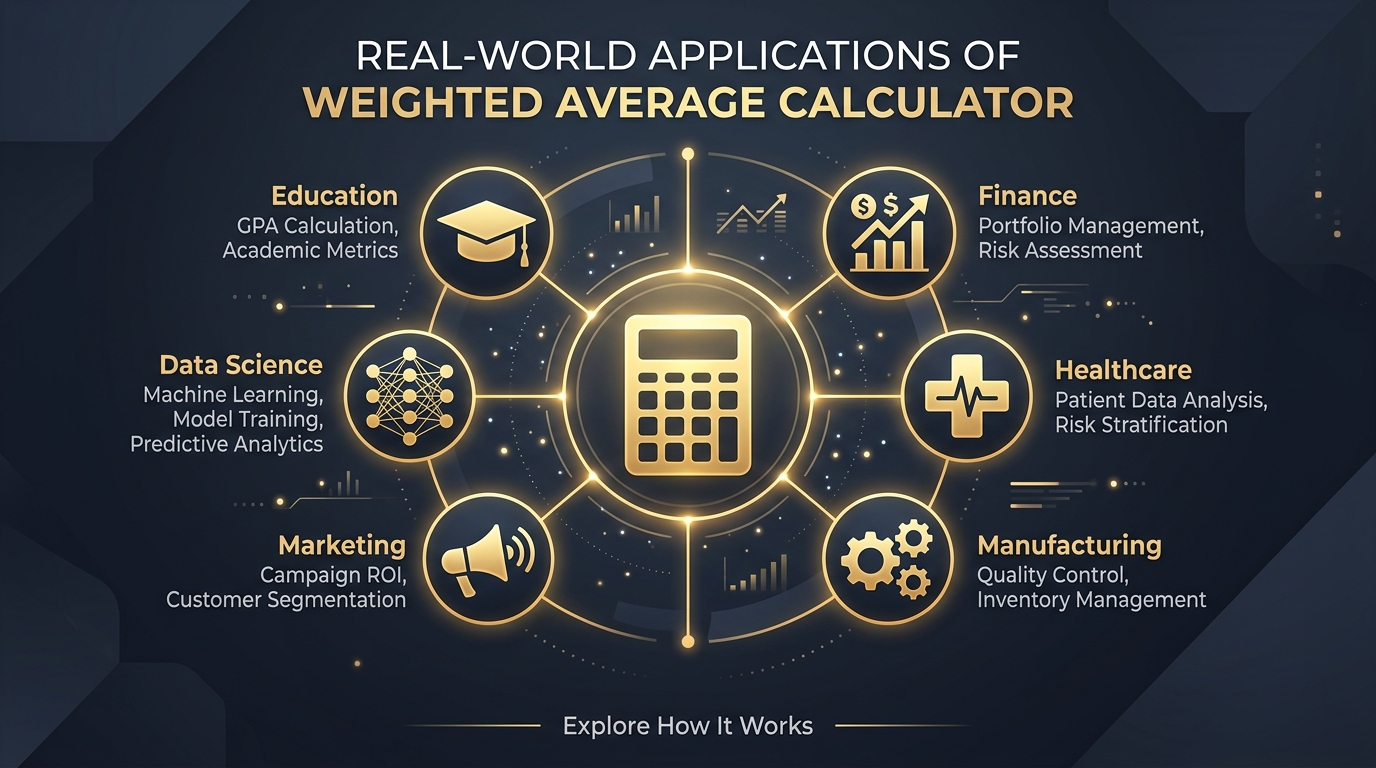
A hospital administrator once told me they used a simple average to compare department performance scores. The result made their emergency department look average. But the ED handled 40% of all patient volume. Once they switched to weighted calculations, the ED's true contribution surfaced, and budgets shifted overnight. That single change in methodology redirected over $2 million in funding.
Weighted average calculators are not just academic tools. They drive decisions worth millions across education, finance, healthcare, manufacturing, and a dozen other sectors. This guide walks through real applications in each industry with concrete examples. Grab our weighted average calculator and follow along as we cover every major use case.
Why Weighted Averages Matter in Real-World Decision-Making
Weighted averages matter because real-world data is never equally important. Treating all numbers the same produces misleading summaries that lead to poor decisions.
Why Equal Values Don't Always Reflect Reality
A simple average of customer satisfaction scores across ten stores treats a location with 50,000 customers the same as one with 200. That makes no mathematical sense. The larger store's feedback represents real experience at scale. The small store's feedback is noise by comparison.
The Importance of Prioritizing High-Impact Data
Every organization has data that matters more. A final exam matters more than a pop quiz. A billion-dollar stock holding matters more than a thousand-dollar position. Weighted averages formalize this priority system and remove guesswork from reporting.
How Weighted Calculations Improve Decisions
When you weight data by importance, your summaries reflect reality. Budgets go where they belong. Performance reviews reward actual contribution. Portfolio reports show true returns. The difference between a simple average and a weighted one can change the entire conclusion.
From Raw Data to Better Insights
Raw data tells you what happened. Weighted data tells you what matters. That transition from observation to insight is where weighted average calculators add genuine value. Learn how the formula works behind the scenes in our guide on how a weighted average calculator works.
Industry Impact: Where Weighted Averages Drive Decisions
DiagramEducation: Measuring Academic Performance More Fairly
Education relies on weighted averages more than almost any other field. Every GPA calculation, every course grade with different assignment categories, and every credit hour evaluation uses this method.
Course Grades
Most courses split grades across homework (20%), midterms (30%), and finals (50%). A student scoring 100 on homework and 60 on the final earns a 74, not the 80 a simple average would show. The final's weight reflects its greater assessment value.
GPA Calculations
GPA multiplies each course grade by its credit hours. A 4-credit A (4.0) and a 1-credit C (2.0) produce a GPA of 3.6, not the 3.0 a simple average suggests. Credit-hour weighting ensures intensive courses shape the GPA more than lightweight ones.
Assignment Weighting
Teachers assign different weights to quizzes, essays, labs, and exams. This lets them emphasize mastery demonstrations over participation scores. Without weighting, a student could ace every quiz and fail the exam but still appear competent.
Credit Hour Evaluation
Universities use credit hours as weights when calculating cumulative GPA, academic standing, and honors eligibility. A student taking 18 heavy-credit STEM courses gets a more accurate GPA than one calculated with simple averaging.
Why Schools Prefer Weighted Averages
Schools prefer weighted averages because they distinguish between genuine mastery and surface-level performance. A weighted system rewards depth of understanding over breadth of participation.
Finance: Evaluating Portfolio Performance
Finance is where weighted averages arguably matter most. Every portfolio return, cost of capital calculation, and asset allocation report depends on weighting by investment size.
Investment Allocation
A portfolio with 70% in bonds returning 4% and 30% in stocks returning 12% earns a weighted return of 6.4%, not the 8% a simple average suggests. The bond-heavy allocation pulls the true return downward, which is the accurate picture.
Portfolio Returns
Fund managers report weighted returns to investors because they reflect actual dollars earned. A $500,000 position gaining 2% contributes more to total return than a $10,000 position gaining 20%. Explore this in depth with our guide on calculating investment returns with weighted averages.
Asset Distribution
Weighted averages help advisors understand how different asset classes contribute to overall risk and return. A tech-heavy portfolio behaves differently than a balanced one, and weighting reveals exactly how each sector moves the needle.
Risk Contribution
Risk managers weight each position's volatility by its portfolio share. A volatile stock representing 5% of the portfolio contributes less risk than a moderately volatile bond representing 60%. Weighting captures this proportional impact.
Measuring Overall Investment Performance
The weighted average cost of capital (WACC) is one of the most important metrics in corporate finance. It weights the cost of debt and equity by their proportions in the capital structure. Every company valuation starts here.
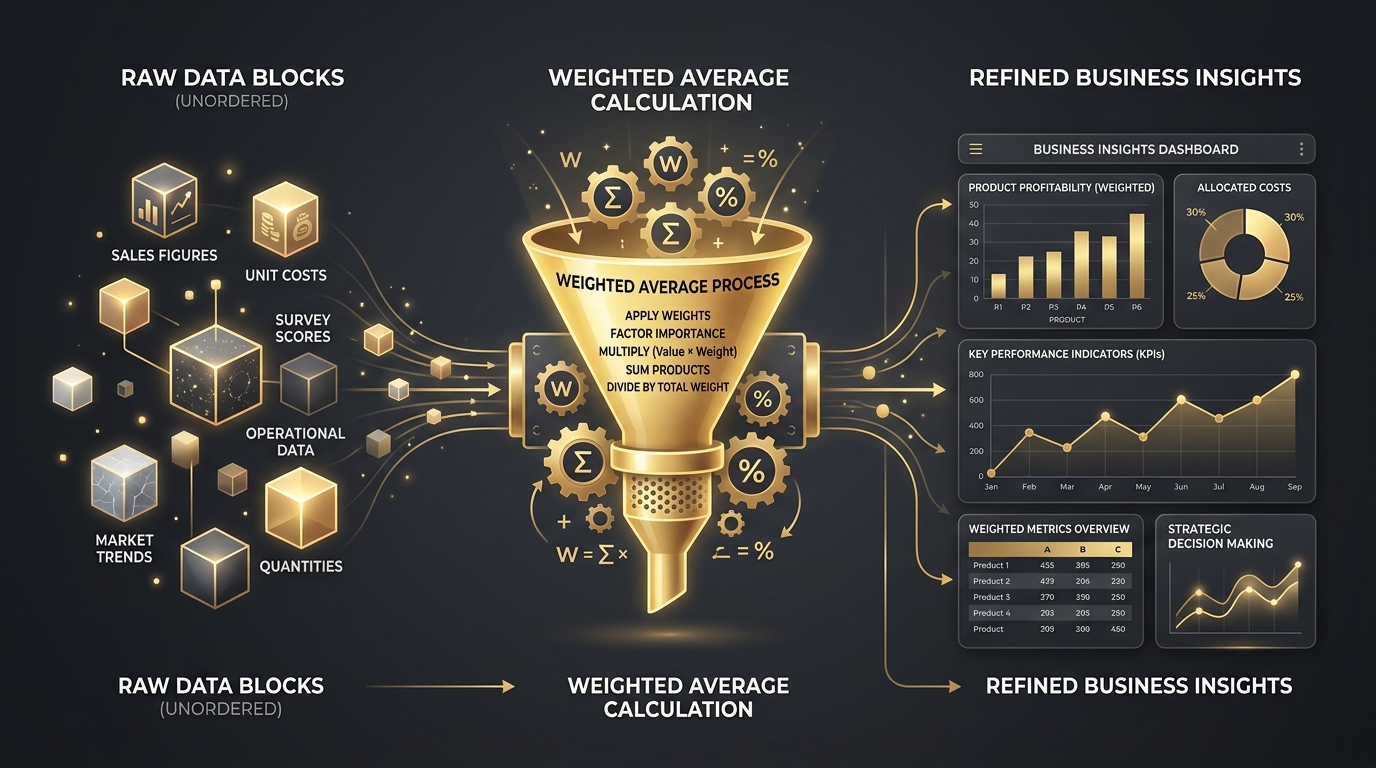
Weighted averages transform raw data into actionable insights across every industry
Accounting: Managing Inventory Costs
Accountants use weighted average cost methods to value inventory, calculate cost of goods sold, and maintain consistent financial reporting across fluctuating purchase prices.
Inventory Valuation
When a retailer buys 100 units at $10 and 300 units at $12, the weighted average cost per unit is $11.50. This smooths out price fluctuations and provides a stable cost basis for financial statements.
Cost of Goods Sold (COGS)
COGS under the weighted average method uses the blended cost per unit to value items sold. This prevents profit swings caused by price variation in raw materials. Many companies prefer this stability for quarterly reporting.
Periodic Inventory Systems
Periodic systems recalculate the weighted average cost at the end of each accounting period. Every unit in inventory gets the same blended cost, simplifying bookkeeping for companies with high transaction volumes.
Moving Weighted Average Cost
Perpetual inventory systems update the weighted average after every purchase. This real-time approach gives managers current cost data for pricing decisions without waiting for period-end calculations.
Why Businesses Use the Weighted Average Cost Method
Businesses choose this method for simplicity and consistency. Unlike FIFO or LIFO, the weighted average smooths volatility and reduces the impact of price spikes on reported profits.
Statistics: Improving Data Accuracy
Statisticians use weighted averages to correct for unequal sample sizes, varying data reliability, and known population proportions in survey and research data.
Survey Analysis
A national survey might oversample rural areas to get reliable local data. The weighted average corrects this by giving urban responses proportionally more weight in national estimates, reflecting the true population distribution.
Sampling Weights
Sampling weights adjust for design effects in complex surveys. If certain demographic groups are underrepresented, weights bring the sample statistics in line with known population parameters.
Population Studies
Census data uses weighted averages to estimate characteristics for populations between full counts. Post-stratification weights ensure estimates reflect the actual demographic composition of the target population.
Research Data
Meta-analyses combine results from multiple studies using weights based on sample size and study quality. A randomized controlled trial with 5,000 participants receives far more weight than an observational study with 50.
Giving Greater Importance to Reliable Data
The core principle is elegantly simple: more reliable data deserves more influence on the final result. Weighted averaging formalizes this intuition into a mathematically defensible procedure.
Interactive: Weighted Average in Education vs Finance
Live Demo🎓 Education: GPA
📈 Finance: Portfolio
Business Intelligence and Analytics
Business intelligence teams use weighted averages to build KPI dashboards, performance scorecards, and executive summaries that reflect proportional business impact.
KPI Dashboards
A composite KPI score might weight revenue growth at 40%, customer retention at 30%, and operational efficiency at 30%. This creates a single performance number that prioritizes the metrics leadership cares about most.
Performance Scorecards
Balanced scorecards assign different weights to financial, customer, process, and learning objectives. A company prioritizing growth might weight financial metrics at 50%, while one focused on stability might weight customer metrics higher.
Sales Performance Analysis
Sales teams weight deal size into performance metrics. A rep closing one $500,000 deal contributes more than a rep closing ten $5,000 deals, even though the simple deal count favors the second rep.
Customer Satisfaction Metrics
Net Promoter Scores from enterprise clients often carry more weight than scores from free-tier users. The enterprise feedback represents higher revenue impact and longer-term business relationships.
Prioritizing High-Value Business Indicators
The best dashboards do not treat every metric equally. They weight indicators by business impact, creating summaries that guide action rather than overwhelming with noise.
Manufacturing and Quality Control
Manufacturers use weighted averages to aggregate quality scores, prioritize defect categories, track production efficiency, and evaluate supplier performance by order volume.
Product Quality Scores
A product might be scored on durability (40%), appearance (20%), functionality (30%), and packaging (10%). Weighting ensures a critical durability failure drops the overall score more than a minor packaging scratch.
Defect Analysis
Not all defects are equal. A safety-critical defect in automotive manufacturing carries far more weight than a cosmetic imperfection. Weighted defect scoring helps factories allocate quality resources where they matter most.
Production Efficiency
Production lines running different products at different volumes need weighted efficiency metrics. A line producing 80% of total output should influence the factory average more than a line producing 5%.
Supplier Performance
Procurement teams weight supplier scores by order volume and criticality. A component supplier providing 60% of raw materials gets proportionally more influence on the overall supplier rating than one providing 2%.
Improving Operational Decisions
Weighted quality metrics prevent small, irrelevant issues from masking serious problems. They direct management attention toward the defects and inefficiencies that actually affect the bottom line.
Marketing and Customer Research
Marketing teams use weighted averages to analyze customer satisfaction surveys, aggregate product ratings, evaluate brand performance, and measure campaign effectiveness across channels of different sizes.
Customer Satisfaction Surveys
A satisfaction survey from a segment representing 70% of revenue should influence overall scores more than feedback from a niche segment representing 3%. Weighting by revenue contribution gives a realistic satisfaction picture.
Product Ratings
Product review platforms weight ratings by verified purchase status, review helpfulness votes, and recency. A verified purchase review from last month carries more weight than an anonymous review from two years ago.
Brand Performance
Multi-market brand tracking weights awareness and sentiment scores by market size. Brand performance in a market of 50 million consumers matters more than performance in a market of 500,000 when calculating global brand health.
Campaign Effectiveness
Marketing campaigns across channels produce different volumes of impressions. A channel delivering 10 million impressions should weight more heavily in aggregate performance metrics than one delivering 50,000.
Turning Customer Feedback into Actionable Metrics
Raw customer feedback is noise. Weighted customer feedback is strategy. The weighting transforms opinions into prioritized action items that reflect actual business impact.
Healthcare and Medical Research
Healthcare organizations use weighted averages in clinical trial analysis, patient outcome evaluation, hospital performance benchmarking, and public health studies.
Clinical Trial Analysis
Meta-analyses of drug effectiveness weight each study by sample size and methodological quality. A well-designed trial with 10,000 patients receives far more weight than a pilot study with 30 participants.
Patient Outcome Evaluation
Hospital quality scores weight mortality rates more heavily than patient satisfaction in many composite measures. While patient experience matters, survival outcomes carry the greatest clinical weight.
Hospital Performance Metrics
CMS Hospital Compare ratings use weighted composites that prioritize clinical outcomes over process measures. Hospitals performing well on high-weight metrics rank higher even if their lower-weight scores are average.
Public Health Studies
Epidemiologists weight disease prevalence estimates by population size when combining data from regions of different sizes. A county of 2 million residents contributes more to state-level estimates than a county of 5,000.
Weighting Patient Data for Better Conclusions
Medical decisions backed by weighted data save lives. When a treatment decision depends on combined study results, proper weighting ensures the most reliable evidence drives the conclusion. Check your weighted calculations with our guide on verifying weighted average results.
Engineering and Manufacturing Projects
Engineers use weighted averages to evaluate material performance, assess project risks, measure system reliability, and prioritize competing projects based on strategic importance.
Material Performance Evaluation
Material selection matrices weight properties like tensile strength (35%), corrosion resistance (25%), cost (20%), and machinability (20%). This produces a single score that balances all requirements by importance.
Risk Assessment
Risk matrices multiply likelihood by impact to create a weighted risk score. A low-probability, high-impact event (like structural failure) receives more weight than a high-probability, low-impact event (like minor delay).
System Reliability
System reliability calculations weight component failure rates by criticality. A critical pump failure that shuts down an entire plant carries more analytical weight than a redundant sensor failure.
Project Prioritization
Portfolio management offices weight project scores by strategic alignment (30%), financial return (25%), risk level (20%), and resource requirements (25%). This creates an objective ranking for investment decisions.
Balancing Multiple Performance Factors
Engineering decisions rarely involve a single criterion. Weighted scoring matrices give teams a systematic way to balance competing requirements without letting any single factor dominate irrationally.
Human Resources and Employee Performance
HR departments use weighted averages for performance appraisals, recruitment scoring, employee evaluation systems, and training effectiveness measurement.
Performance Appraisals
Annual reviews might weight goal achievement at 40%, teamwork at 25%, leadership at 20%, and attendance at 15%. This ensures results-oriented behavior gets more recognition than simply showing up.
Recruitment Scoring
Hiring teams weight interview scores by panel member seniority and relevance. The hiring manager's assessment typically carries 40% weight, while a peer interviewer's assessment might carry 20%.
Employee Evaluation Systems
360-degree feedback systems weight inputs from managers, peers, and direct reports differently. Manager feedback usually receives the highest weight because it reflects direct performance observation.
Training Effectiveness
Training ROI calculations weight post-training performance improvements by job criticality. Improvement in safety-critical skills carries more weight than improvement in optional soft skills.
Assigning Different Importance to Evaluation Criteria
Fair evaluation requires transparent weighting. When employees understand which criteria carry the most weight, they can focus their development efforts where they matter most to the organization.
Supply Chain and Logistics
Supply chain managers use weighted averages for vendor evaluation, transportation performance analysis, warehouse efficiency metrics, and procurement decisions.
Vendor Evaluation
Vendor scorecards weight quality (35%), delivery reliability (30%), price competitiveness (20%), and responsiveness (15%). A vendor with perfect quality and delivery scores will outrank a cheaper vendor with quality problems.
Transportation Performance
Logistics teams weight carrier performance by shipment volume. A carrier handling 500 shipments per month has more influence on the weighted performance score than one handling 10.
Warehouse Efficiency
Warehouse KPIs weight order accuracy (40%), pick speed (30%), and space utilization (30%). Accuracy receives the highest weight because errors generate returns, customer complaints, and rework costs.
Procurement Decisions
Total cost of ownership calculations weight purchase price, shipping costs, quality costs, and inventory carrying costs by their proportional impact on total spend.
Optimizing Supplier Selection
The weighted scorecard approach prevents procurement teams from choosing the cheapest option when reliability and quality matter more. It builds a defensible, data-driven selection process.

Weighted average calculations are becoming essential in AI, machine learning, and predictive analytics
Data Science and Artificial Intelligence
Data scientists use weighted averages throughout the machine learning pipeline, from feature engineering and data preprocessing to ensemble models and prediction aggregation.
Feature Weighting
Feature importance scores weight input variables by their predictive power. A feature explaining 30% of variance gets three times the weight of one explaining 10% in model construction.
Machine Learning Models
Ensemble methods like gradient boosting and random forests use weighted combinations of weak learners. Each model's prediction receives a weight based on its accuracy, and the weighted average becomes the final prediction.
Data Preprocessing
Weighted imputation fills missing values using weighted averages of similar observations. Observations closer in feature space receive higher weights, producing more accurate fill values than simple mean imputation.
Predictive Analytics
Forecast combination weights individual model predictions by historical accuracy. A model that predicted correctly 90% of the time receives more weight than one that was right 60% of the time.
Improving Model Accuracy
The difference between a mediocre prediction and an accurate one often comes down to weighting. Proper feature and model weighting can improve prediction accuracy by 15 to 30 percent in practice.
Government and Public Policy
Government agencies use weighted averages for census data analysis, economic indicator construction, policy evaluation, and evidence-based resource allocation.
Census Analysis
Post-census weighting adjusts sample surveys to match known population totals. This corrects for nonresponse bias and ensures estimates represent the actual population, not just the people who answered the survey.
Economic Indicators
The Consumer Price Index (CPI) weights price changes by spending patterns. Housing costs receive about 33% of the total weight because Americans spend roughly a third of their income on housing.
Policy Evaluation
Program evaluations weight outcomes by participant numbers and program costs. A program serving 100,000 people carries more weight in national assessments than a pilot serving 500.
Resource Allocation
Federal funding formulas weight population, poverty rates, infrastructure needs, and geographic factors to distribute resources proportionally. Weighted formulas ensure large, high-need areas receive appropriate funding levels.
Supporting Evidence-Based Decisions
Government decisions affect millions of lives. Weighted data analysis ensures those decisions reflect proportional reality rather than equal treatment of unequal populations.
Which Industries Benefit the Most from Weighted Average Calculations?
High-Volume Data Industries
Industries processing millions of transactions or observations benefit most. Finance, telecommunications, and e-commerce generate massive datasets where weighting separates signal from noise.
Performance-Driven Organizations
Sales organizations, sports analytics firms, and consulting companies that live and die by performance metrics need weighted calculations to evaluate contribution fairly.
Research-Based Fields
Academic research, pharmaceutical development, and public health studies depend on weighted methods to combine evidence from studies of varying quality and size.
Financial Decision-Making
Investment management, corporate finance, accounting, and banking use weighted calculations in virtually every analytical workflow. The financial industry cannot function without them.
Industry Comparison Table
| Industry | Primary Use | Weight Type | Impact Level |
|---|---|---|---|
| Finance | Portfolio returns, WACC | Investment size | Critical |
| Education | GPA, course grades | Credit hours | Critical |
| Healthcare | Clinical trials, outcomes | Sample size | High |
| Manufacturing | Quality scores, defects | Production volume | High |
| Data Science | ML models, predictions | Feature importance | High |
| Government | CPI, census, funding | Population size | High |
| Marketing | Surveys, ratings | Revenue contribution | Medium |
| HR | Appraisals, recruitment | Criteria importance | Medium |
Future Applications of Weighted Average Calculators
Artificial Intelligence
AI systems will increasingly rely on weighted aggregation for explainability. As regulators demand transparency in automated decisions, weighted scoring provides a clear audit trail showing how each factor influenced the outcome.
Big Data Analytics
Real-time weighted calculations on streaming data will become standard. Modern data platforms can compute weighted averages across billions of records in seconds, enabling instant insights at scale.
Predictive Modeling
Weighted ensemble models will dominate prediction markets. Combining multiple AI models with accuracy-based weights consistently outperforms any single model approach in forecasting competitions.
Automation Platforms
No-code business intelligence tools are adding weighted average functions. This democratization means small businesses can access the same weighted analysis that was previously available only to enterprises with data science teams.
Emerging Business Trends
The trend is clear: as data volumes grow, the need for intelligent weighting grows with them. Organizations that master weighted analysis will make better decisions faster than competitors stuck on simple averages.
Frequently Asked Questions
What industries use weighted average calculators?
Education, finance, accounting, healthcare, manufacturing, marketing, human resources, data science, government, and supply chain management all use weighted average calculators for daily decisions.
Why are weighted averages important in business?
Weighted averages let businesses prioritize high-impact data. A sales region generating 80% of revenue should influence company averages more than a region generating 5%. Without weighting, reports distort reality.
How are weighted averages used in healthcare?
Healthcare uses weighted averages in clinical trials to weight larger studies more heavily, in patient outcome tracking, and in hospital performance scoring where life-threatening conditions carry more weight than minor issues.
Why do researchers use weighted averages?
Researchers combine data from studies of different sizes and reliability levels. A study with 10,000 participants provides more statistical power than one with 100, so it receives a proportionally larger weight in the analysis.
Are weighted averages useful in marketing?
Yes. Marketing teams use weighted averages to evaluate customer satisfaction surveys, product ratings, brand performance metrics, and campaign effectiveness. High-value customer feedback often receives greater weight.
How do manufacturers use weighted averages?
Manufacturers weight quality scores by production volume, defect rates by severity, and supplier performance by order size. This ensures critical quality factors drive decisions rather than cosmetic issues.
Can HR departments use weighted averages?
Absolutely. HR teams use weighted averages in performance appraisals, recruitment scoring, and training effectiveness measurement. Leadership skills might count more than attendance in a weighted evaluation system.
Why is weighted averaging important in data science?
Data scientists use weighted averages for feature weighting in machine learning models, ensemble predictions, and data preprocessing. Correct weights directly impact model accuracy and prediction quality.
Which industry benefits the most from weighted averages?
Finance arguably benefits most because every major financial calculation involves proportional allocation. Portfolio returns, cost of capital, inventory valuation, and risk assessment all depend on weighted methods.
Can small businesses benefit from weighted average calculations?
Yes. Small businesses use weighted averages for inventory costing, employee evaluations, customer feedback analysis, and vendor selection. The calculations are simple enough for a spreadsheet yet powerful enough to improve decisions.
Conclusion
Weighted average calculators are not niche tools for mathematicians. They power GPA calculations in universities, portfolio returns on Wall Street, quality scores in factories, clinical trial analyses in hospitals, and policy decisions in government agencies. Every industry that deals with data of varying importance relies on this single concept.
The pattern is consistent across every sector covered in this guide: when data points carry unequal weight, simple averages produce misleading results. Weighted averages fix this by letting importance shape the outcome. Whether you manage a classroom, a portfolio, a factory floor, or a clinical trial, the principle remains the same.
Start applying weighted calculations to your own data today. Our weighted average calculator handles the math instantly so you can focus on the decisions that matter. The organizations that weight their data intelligently will always outperform those that treat every number the same.