
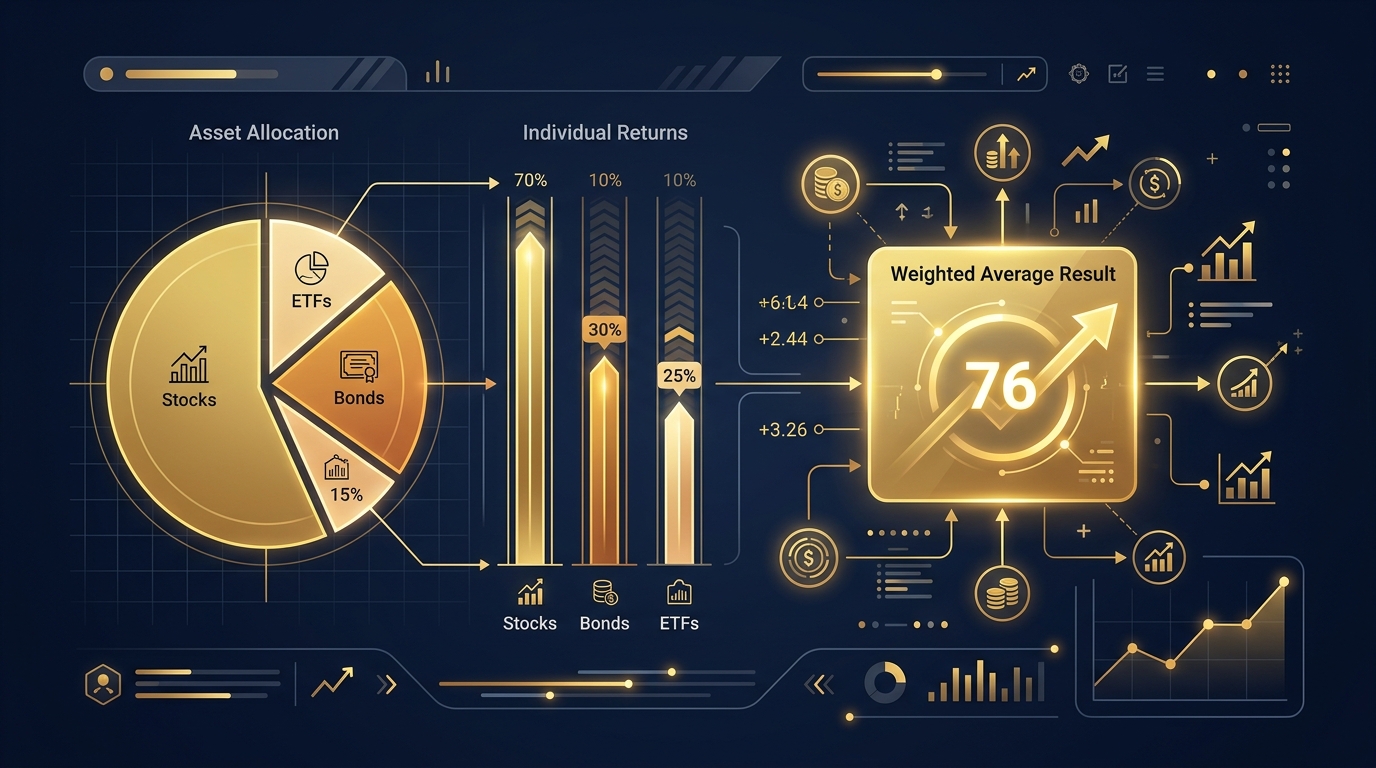
Last year I watched a colleague proudly announce her portfolio gained 15% overall. She averaged three fund returns and called it a day. The real number, after weighting each position by actual capital invested, was 9.2%. That 5.8% gap was not a rounding error. It was nearly six thousand dollars of phantom gains on a $100,000 portfolio. A weighted average calculator would have caught this in seconds.
Portfolio return measurement sits at the heart of every investment decision you make. Get it wrong and you misjudge risk, misallocate capital, and chase strategies that look better than they actually perform. This guide walks through the complete process of calculating investment returns with weighted averages, from gathering data to interpreting results across stocks, bonds, ETFs, crypto, and real estate.
Why Investors Use Weighted Averages to Measure Portfolio Performance
Weighted averages reveal how much each dollar actually contributed to your portfolio return, not just the average percentage across holdings. This distinction separates informed investors from those flying blind.
Why Equal Returns Don't Tell the Whole Story
A simple average treats a $500 position the same as a $50,000 position. That makes no mathematical sense when measuring real money performance. Two investments returning 20% and 5% produce a simple average of 12.5%. But if 90% of your capital earned only 5%, your actual return sits much closer to 6.5%. The weighted average calculator on our homepage handles this distinction automatically.
The Role of Investment Allocation
Allocation determines how portfolio weight distributes across assets. A 60/40 stock-bond split behaves fundamentally differently from an 80/20 split, even when individual returns stay identical. The weight each asset carries transforms the final blended return.
How Portfolio Weights Influence Overall Returns
An asset holding 50% of your portfolio contributes half the weighted return calculation. A position holding 2% barely moves the needle regardless of its individual performance. Understanding this relationship prevents overreacting to small position gains and underreacting to large position losses.
Understanding Return Contribution
Return contribution equals the asset return multiplied by its portfolio weight. A stock returning 18% with a 40% weight contributes 7.2 percentage points. A bond returning 4% at 60% weight contributes 2.4 points. The portfolio weighted return becomes 9.6%, which neither individual return suggests on its own.
Return Contribution Breakdown
InteractiveWhat Investment Information Do You Need Before You Begin?
You need four data points for each asset: individual return, investment amount, allocation percentage, and measurement period. Missing any one of these leads to unreliable results.
Individual Asset Returns
Record the percentage return for each holding over the same time period. Use total return figures that include both price appreciation and dividend income for the most accurate picture.
Investment Amount for Each Asset
Document the dollar amount placed into each position. Original cost basis works for measuring historical performance. Current market value works better for forward-looking analysis.
Portfolio Allocation Percentages
Calculate what percentage of total portfolio value each asset represents. A $30,000 position in a $100,000 portfolio carries a 30% weight. These percentages should sum to 100% across all holdings.
Time Period of Measurement
All returns must cover the same time window. Mixing a three-month stock return with a twelve-month bond return produces meaningless results. Standardize everything to the same quarter, year, or custom period.
Organizing Your Portfolio Data
Create a simple spreadsheet with columns for asset name, return percentage, dollar amount, and portfolio weight. This structure feeds directly into the calculation and makes recalculation after changes straightforward.
Choosing the Correct Weight for Each Investment
The weight you choose fundamentally changes your result, so selecting the right weighting method matters as much as the return data itself.
Weight Based on Capital Invested
Dollar-weighted returns show how your actual money performed. If you invested $40,000 in stocks and $10,000 in bonds, the stock return carries four times the influence. This method answers the question: how much did I actually earn?
Weight Based on Portfolio Percentage
Percentage weights normalize everything to proportions. A 70/30 split applies regardless of whether the portfolio totals $10,000 or $10 million. This method works well for comparing performance across portfolios of different sizes.
Current Value vs Original Investment
Original investment weights measure historical decision quality. Current value weights reflect today's actual risk exposure. A position that doubled in value now carries more portfolio risk than your original allocation intended. Learn more about how weights work in our guide on how a weighted average calculator works.
Which Weighting Method Is Best?
Use dollar amounts for personal performance tracking. Use percentages for portfolio comparison and reporting. Use current values for risk assessment and rebalancing decisions. No single method works for every situation.
Weighting Method Comparison
Diagram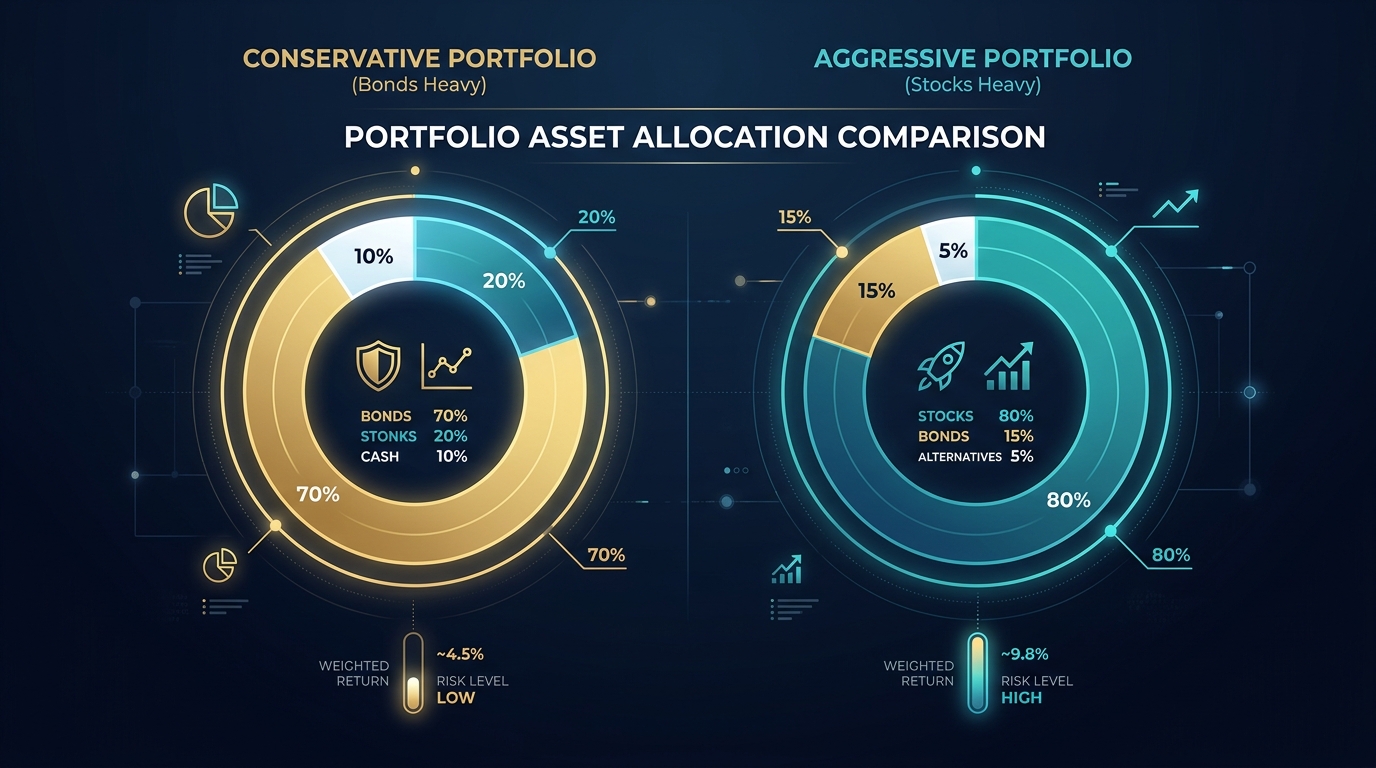
Different asset allocations produce significantly different weighted portfolio returns even when individual asset performance stays the same
Step-by-Step: Calculating Portfolio Returns with a Weighted Average Calculator
The calculation follows four clear steps that transform raw portfolio data into a single meaningful return figure.
Enter Each Investment
Input each asset name or identifier along with its return percentage. Most calculators accept both positive and negative returns, handling losses as naturally as gains.
Assign Portfolio Weights
Enter the weight for each corresponding asset. Whether you use dollar amounts or percentages depends on your chosen weighting method. The calculator normalizes either format.
Add Individual Returns
After entering values and weights, the calculator pairs each return with its weight automatically. You can review these pairs before computing to catch data entry errors early.
Generate the Portfolio Return
The calculator multiplies each return by its weight, sums all products, then divides by total weight. The result is your true weighted portfolio return. For a detailed walkthrough of manual calculation, see our guide on calculating weighted averages by hand.
Reviewing the Final Calculation
Always check that the weighted return falls between your highest and lowest individual returns. A result outside this range signals a data entry error in either the returns or the weights.
Live Portfolio Return Calculator
InteractiveExample Portfolio Return Calculations
Real numbers make the concept concrete. Here are three portfolio scenarios showing how weighted averages work in practice.
Example 1: Two-Stock Portfolio
You hold $60,000 in a tech stock returning 15% and $40,000 in a utility stock returning 6%. The tech weight is 60% and utility is 40%. Weighted return: (15 x 0.60) + (6 x 0.40) = 9.0 + 2.4 = 11.4%. A simple average would have given 10.5%, overstating the utility stock influence.
Example 2: Diversified Portfolio
Consider five holdings: large-cap stock (30% weight, 14% return), international stock (20%, 9%), bonds (25%, 3.5%), REIT (15%, 11%), and cash (10%, 1%). Weighted return: 4.2 + 1.8 + 0.875 + 1.65 + 0.1 = 8.625%. Diversification pulled the return below the top performer but stabilized overall risk.
Example 3: Stocks and Bonds Portfolio
A retirement-focused 40/60 portfolio holds growth stocks at 40% returning 16% and aggregate bonds at 60% returning 5%. Weighted return: (16 x 0.40) + (5 x 0.60) = 6.4 + 3.0 = 9.4%. The bond-heavy allocation anchored the return closer to fixed income performance.
Comparing Different Asset Allocations
The same assets with an 80/20 split would produce (16 x 0.80) + (5 x 0.20) = 13.8%. That is a 4.4 percentage point difference from a single allocation change. This illustrates why understanding portfolio weights matters more than chasing individual asset returns.
Allocation Impact Simulator
InteractiveHow Asset Allocation Changes Your Overall Return
Allocation is the single largest driver of portfolio performance, accounting for roughly 90% of return variation according to landmark studies.
Increasing Exposure to High-Return Assets
Shifting weight toward equities amplifies both gains and losses. Moving from 60% stocks to 80% stocks boosts weighted return in bull markets but magnifies drawdowns during corrections. The weighted calculation reveals exactly how much additional return you gain per percentage point of increased stock exposure.
Reducing Portfolio Risk
Adding bonds, cash, or low-correlation alternatives reduces portfolio volatility. The weighted return drops but so does the standard deviation of outcomes. For many investors, a lower but more consistent weighted return actually builds more wealth over time through avoiding large drawdowns.
Rebalancing Effects
After a strong equity rally, stocks consume a larger portfolio share than intended. Rebalancing back to target weights sells high and buys low automatically. The weighted return after rebalancing typically trails momentum-driven returns short-term but outperforms over full market cycles.
Before-and-After Allocation Example
A portfolio starting at 60/40 stocks-bonds drifts to 72/28 after a stock rally. Before rebalancing: (18 x 0.72) + (3 x 0.28) = 13.8%. After rebalancing back to 60/40: (18 x 0.60) + (3 x 0.40) = 12.0%. The 1.8% difference represents the cost of risk reduction through disciplined rebalancing.
Expected Return vs Actual Portfolio Return
Expected returns are forward-looking estimates. Actual returns are backward-looking facts. The gap between them drives portfolio management decisions.
Estimated Performance
Expected weighted return uses projected returns from analyst estimates or historical averages. A portfolio expecting 10% from stocks and 4% from bonds at 70/30 weights projects 8.2% overall. This becomes a benchmark for measuring actual performance.
Historical Performance
Actual weighted return uses realized results over a completed period. The same portfolio might deliver 13% stock returns and 2% bond returns, producing a 9.7% weighted return. Outperforming your expected return by 1.5% suggests favorable market conditions rather than superior skill.
Forecasting Limitations
Expected returns assume normal market conditions. Black swan events, interest rate shocks, and sector rotations create persistent gaps between expectations and reality. Reviewing weighted returns quarterly helps you identify when actual performance consistently deviates from projections.
When Expectations Differ from Reality
A sustained gap signals either flawed assumptions or changed market conditions. If your weighted return trails expectations for three consecutive quarters, revisit your return assumptions and allocation strategy rather than doubling down on the original forecast.

Tracking weighted portfolio returns over time reveals performance patterns that single-period snapshots miss entirely
Calculating Returns for Different Types of Investments
Every investment type feeds into the weighted average formula identically. The only difference lies in how you define the return for each asset class.
Stocks
Use total return including dividends. A stock bought at $100 that reaches $112 and pays $2 in dividends delivers a 14% total return, not the 12% price return alone.
Mutual Funds
NAV-based total return captures reinvested distributions. Fund fact sheets report this figure directly, making it the easiest asset class to plug into a weighted calculation.
ETFs
ETF returns track their underlying index minus the expense ratio. Use market-price total return for actual investor experience, which may differ slightly from NAV return due to trading premiums or discounts.
Bonds
Bond returns combine coupon income with price changes. A bond yielding 4% that loses 2% in market value delivers a 2% total return. Rising interest rates make bond return calculation especially important for weighted portfolio measurement.
Cryptocurrency
Crypto returns are pure price appreciation since most tokens pay no income. The extreme volatility means weighted portfolio impact swings dramatically even at small allocations. A 5% crypto position returning 80% contributes 4.0 percentage points, which can dominate portfolio results.
Real Estate Investment Portfolios
REITs report total returns including distributions. Direct property investments require calculating net rental income plus appreciation minus expenses. Use the annualized figure for consistency with other asset class returns in your weighted calculation.
Factors That Can Affect Your Weighted Portfolio Return
Several external and internal forces create gaps between your calculated weighted return and actual portfolio experience.
Market Volatility
High volatility amplifies the impact of measurement timing. Calculating returns on a market peak versus a trough can swing weighted results by several percentage points for equity-heavy portfolios.
Portfolio Diversification
Broad diversification across uncorrelated assets tends to compress weighted returns toward the middle of the range while reducing overall variance. Concentrated portfolios produce more extreme weighted return figures.
Investment Timing
Cash flows during the measurement period complicate return calculation. Adding $20,000 mid-quarter changes the effective weight of that position for the period. Time-weighted returns address this by neutralizing cash flow effects.
Rebalancing Frequency
Monthly rebalancing produces different weighted returns than annual rebalancing because the effective weights shift throughout the year. More frequent rebalancing keeps weights closer to targets but increases transaction costs.
Fees and Expenses
Fund expense ratios, advisory fees, and transaction costs reduce each asset's net return before the weighting calculation. A 1% advisory fee applied across the portfolio reduces weighted return by exactly 1 percentage point, regardless of allocation.
Understanding Return Differences
When your calculated weighted return differs from your brokerage statement, fees and cash flow timing are the most common culprits. The weighted average formula itself is mathematically precise. The inputs determine accuracy.
Portfolio Return Impact Factors
DiagramCommon Portfolio Return Calculation Mistakes
Even experienced investors make these errors. Each one distorts your weighted portfolio return and leads to poor decisions.
Using Equal Weights by Mistake
Averaging returns without weighting assumes every position is the same size. This rarely reflects reality and consistently misrepresents actual performance. Always apply weights proportional to invested capital.
Ignoring Portfolio Rebalancing
Using original weights after months of market movement produces stale calculations. Asset prices shift your actual allocation daily. Recalculate weights before computing returns, especially after volatile periods.
Mixing Percentage and Dollar Weights
Entering 40% for one asset and $30,000 for another creates a nonsensical calculation. Choose one weighting format and apply it consistently across every position in the portfolio.
Forgetting to Update Asset Values
Stale data produces stale results. If you rebalanced two months ago and prices shifted substantially, your current weights no longer match what you entered. Update all values before recalculating.
Portfolio Review Checklist
Before each calculation, verify that all returns cover the same period, all weights use the same format, weights sum to approximately 100%, and no position data is more than one business day old. This prevents the most common errors.
Best Practices for Measuring Investment Performance
Consistent measurement discipline separates investors who learn from their results from those who repeat mistakes quarter after quarter.
Review Portfolio Regularly
Quarterly calculations strike the right balance between staying informed and avoiding overreaction. Monthly reviews work for active traders. Annual reviews risk missing important mid-year shifts in allocation and performance.
Recalculate After Major Changes
Any deposit exceeding 10% of portfolio value, any withdrawal, or any deliberate rebalancing event warrants an immediate recalculation. These changes alter your effective weights enough to change the weighted return meaningfully.
Maintain Consistent Weighting
Pick a weighting method and stick with it across measurement periods. Switching between dollar weights and percentage weights between quarters makes trend comparison impossible.
Compare Against Benchmarks
Your weighted portfolio return gains meaning when compared against a relevant benchmark. A 60/40 portfolio should measure against a 60/40 index blend, not the S&P 500 alone. This reveals whether your specific holdings added or subtracted value relative to passive alternatives. Explore our full explanation in the introduction to weighted average calculators.
Creating a Long-Term Performance Tracking Routine
Record each quarter's weighted return in a running log alongside benchmark returns and allocation snapshots. After two years you will spot patterns in your investment behavior that raw portfolio values never reveal. This historical record becomes your most valuable investment tool.
Frequently Asked Questions
How do you calculate portfolio returns using a weighted average?
Multiply each asset's return by its portfolio weight. Sum all the products. Divide by total weight. The result is your portfolio's true weighted return reflecting actual capital allocation across holdings.
Why are portfolio returns weighted?
Larger investments have proportionally greater impact on total performance. Weighting ensures a 12% return on a $50,000 position counts more than 12% on a $5,000 position in your overall calculation.
Can I calculate mutual fund returns with a weighted average?
Yes. Enter each fund's total return as the value and its allocation percentage or dollar amount as the weight. The calculator blends all fund returns into a single portfolio figure.
Should I use current value or original investment as the weight?
Original investment for measuring past decision quality. Current value for assessing today's risk exposure. Each method answers a different question about your portfolio.
How often should I recalculate my portfolio return?
Quarterly reviews suit most investors. Recalculate immediately after major deposits, withdrawals, or rebalancing events that change allocation by more than five percentage points.
Does portfolio diversification affect weighted returns?
Yes. Spreading capital across uncorrelated assets compresses the range of possible weighted returns while typically reducing volatility without proportionally reducing expected return.
Can a weighted average calculator measure ETF performance?
Absolutely. ETFs function identically to stocks in a weighted calculation. Enter the ETF total return and its portfolio weight to determine its contribution to blended performance.
What happens if I rebalance my portfolio?
Rebalancing shifts the weights assigned to each holding. You must recalculate using updated allocation percentages for an accurate forward-looking weighted portfolio return.
Does this method include dividends?
Only if you enter total return figures that include dividend income. Price return alone excludes dividends, which can understate actual portfolio performance by 1 to 3 percentage points annually.
Can I use a weighted average calculator for retirement portfolios?
Yes. Retirement portfolios containing mixed stocks, bonds, and target-date funds benefit significantly from weighted calculations that reflect actual allocation across all asset classes.
Final Thoughts
Measuring investment returns without weighting is like judging a race without timing the runners. The numbers look valid on the surface but fail to reflect reality. A weighted average calculator removes the guesswork by tying each return to its true portfolio influence.
I have seen investors change their entire strategy after discovering that their "best performing" fund contributed less to overall returns than a boring bond allocation carrying three times the weight. That moment of clarity only happens when you measure correctly.
Start by gathering your current holdings and returns, pick a consistent weighting method, and run the calculation quarterly. Within a year you will understand your portfolio's actual behavior better than most professional financial advisors understand theirs. The numbers never lie when the weights are right.