
A colleague once told me his portfolio returned 14.2% last year. He ran his numbers through a weighted average calculator, got a single number, and used it in every meeting for a month. The problem was that he never verified what that number actually represented. When I looked at his inputs, two of his weights were swapped. His real return was 9.1%. That five-point gap changed how his team evaluated three investment decisions. The calculator did its job perfectly. The interpretation did not.
This guide explains exactly what every output of a weighted average calculator means, how to read it correctly, and when to question it. You will learn to validate results, explain them to others, and avoid the interpretation errors that quietly derail decisions. Whether you are reviewing grades, investment returns, or survey data, these insights apply to every result you will ever see.
Understanding the Result Displayed by a Weighted Average Calculator
The result displayed by a weighted average calculator is a single number that reflects the combined influence of every value in your data set, adjusted by importance. It is not a raw total or a simple midpoint. It is a measurement shaped by how much each entry matters.
What the Final Weighted Average Represents
The final number tells you the central tendency of your data after accounting for unequal importance. If you entered three exam scores with credit-hour weights, the result represents your true academic performance across those courses, not just a number halfway between the highest and lowest score. Think of it as the answer to the question: "What is the single best summary of my data when some parts matter more than others?" Using our weighted average calculator makes this process instant.
Why the Result Is Different from a Simple Average
A simple average treats every value identically. A weighted average multiplies each value by its importance before combining them. When a score of 92 carries a weight of 5 and a score of 68 carries a weight of 1, the 92 has five times more pull on the final result. The simple average of 92 and 68 is 80.0. The weighted average is 88.0. That eight-point gap exists entirely because the calculator respects the weight assignments you provided.
How the Calculator Determines the Final Value
The process follows three steps. First, it multiplies each value by its corresponding weight. Second, it sums all those weighted products. Third, it divides that sum by the total of all weights. The formula is: Weighted Average = Sum(Value x Weight) / Sum(Weight). Every reliable calculator uses this exact sequence, which is why results are consistent across different tools when the same inputs are entered.
Reading the Result at a Glance
When you see the output, check two things immediately. First, does it fall between your lowest and highest values? It should always sit within that range. Second, is it closer to the values with the largest weights? If not, double-check your inputs. These two instant checks catch most errors before they become costly mistakes.
Result Breakdown Explorer
InteractiveEnter values and weights to see how the weighted average is calculated step by step:
What Information Is Included in the Final Result?
A complete weighted average output typically includes four components: the weighted average itself, the sum of weighted values, the total weight, and the number of data entries. Each component serves a distinct purpose in your analysis.
Weighted Average
This is the primary result. It is the number you cite in reports, use in decisions, and compare against benchmarks. It represents the importance-adjusted center of your entire data set.
Sum of Weighted Values
This is the total you get after multiplying every value by its weight and adding them together. It serves as the numerator in the weighted average formula. On its own, it has limited meaning because it has not been adjusted for total weight yet. But it helps you verify the math by tracing exactly how much each value contributed to the whole.
Total Weight
The sum of all individual weights acts as the divisor. It tells you the combined scale of importance across your data. A total weight of 10 with three entries means weights are spread unevenly. A total weight of 3 with three entries means each weight is 1, making the result identical to a simple average. Understanding this helps you learn how a weighted average calculator works behind the scenes.
Number of Data Entries
The count of entries confirms how many value-weight pairs went into the calculation. This matters because adding or removing even one entry changes the result. If you expected five entries but the calculator shows four, a missing data point could be skewing your output.
Why Each Output Matters
Together, these four components give you full transparency. The weighted average is your answer. The sum of products and total weight let you verify the math. The entry count confirms completeness. Ignoring any one of them reduces your ability to catch errors or explain the result to others.
Output Components Breakdown
DiagramHow Should You Interpret a High or Low Weighted Average?
A high weighted average means your heavily weighted values are on the upper end of your data range. A low result means larger weights sit on lower values. The direction tells you where the concentration of importance lies.
What a Higher Result Indicates
A higher weighted average signals that your most important data points have strong values. In academics, it means your high-credit courses have better grades. In finance, it means your largest investments performed well. In surveys, it means your biggest respondent groups gave favorable scores. The result gravitates toward wherever the weight is concentrated.
What a Lower Result Indicates
A lower result means the opposite. Your heaviest weights are attached to values on the lower end. A student scoring 95 in a 1-credit elective and 72 in a 4-credit core course will see a weighted GPA pulled sharply toward 72. The elective's wonderful score barely registers because its weight is one-fourth of the core course.
How Large Weights Influence the Outcome
The larger a weight, the more its attached value dominates the final number. A single entry with weight 10 has the same pull as ten entries with weight 1. This concentration effect is exactly why weighted averages exist. They let a single critical measurement shape the result proportionally to how much it matters. The weighted grade calculator demonstrates this effect clearly with academic scores.
Understanding Relative Performance
Compare your weighted average against the simple average of the same data. If the weighted result is higher, your important items outperform your less important ones. If lower, the reverse is true. This comparison reveals whether your best efforts are concentrated where they matter most or scattered across low-priority areas.
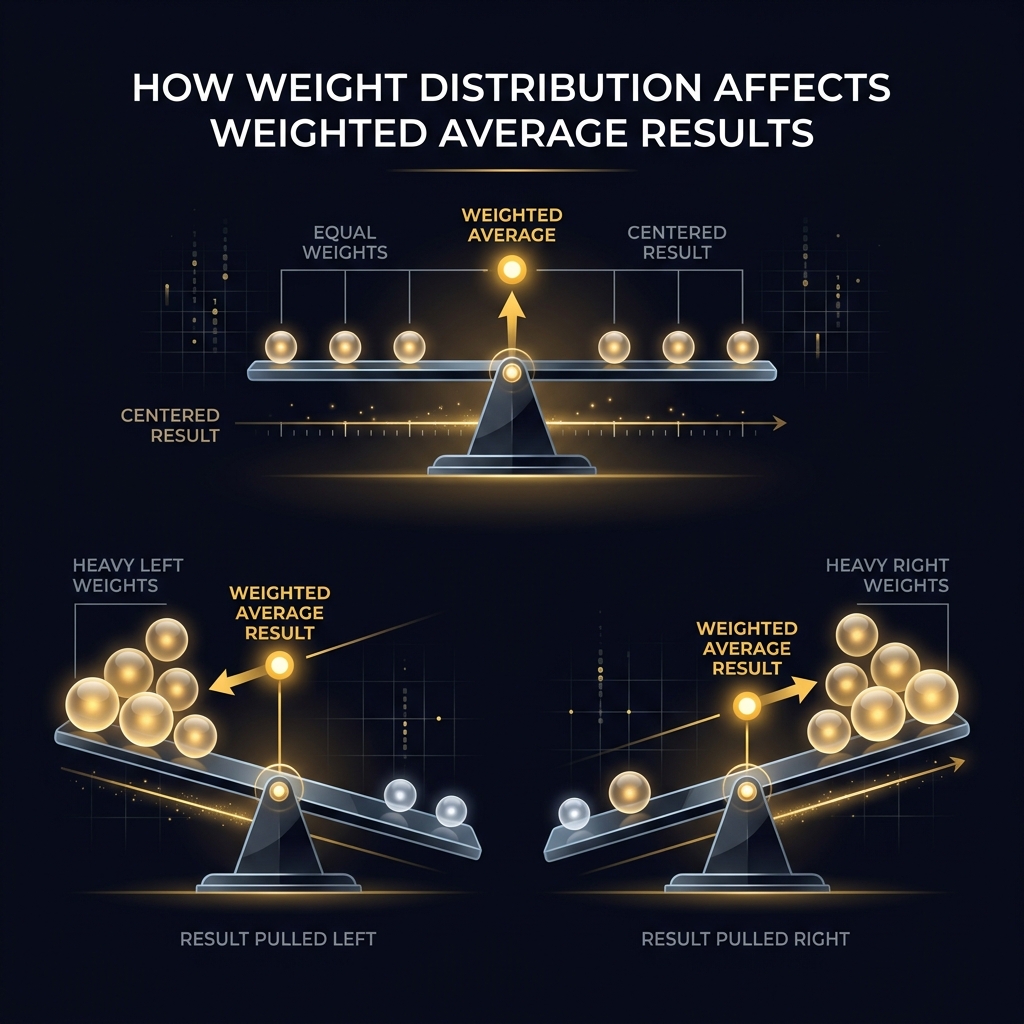
Weight distribution determines where your weighted average falls within your data range
Why Is Your Weighted Average Different from Your Expected Result?
Four common factors create gaps between your expected result and the actual weighted average: unequal weights, the dominance of high-weight values, small changes amplified by large weights, and mental estimation errors.
Unequal Weights
Most people instinctively expect a result near the arithmetic middle of their values. But unequal weights shift the result away from that midpoint. If you entered values of 90 and 70 with weights of 8 and 2, you might expect something near 80. The actual result is 86. Weights create asymmetry that your mental math does not naturally account for.
Strong Influence of High-Weight Values
A single value carrying 60% of the total weight essentially controls the outcome. The remaining values collectively influence only 40% of the result. If that dominant value is lower than you expected, the entire average drops below your mental estimate.
Small Changes with Large Weights
Changing a value by 2 points might seem insignificant. But if that value carries a weight of 20, the change contributes 40 points to the sum of products. That 40-point shift divided across total weight can move the final result by a full point or more. Small input changes produce outsized output changes when weights are large.
Differences from Manual Estimates
Human estimation tends to round, simplify, and average mentally using equal weights. We naturally gravitate toward the arithmetic mean. When the actual calculation applies unequal weights, the result almost always differs from what felt right intuitively. This is not an error. It is the calculator doing exactly what it should.
Common Interpretation Errors
The most frequent mistake is assuming the result should be close to the middle of your values. The second most common error is forgetting that one heavy weight can move the result more than five lighter ones combined. The third is expecting the result to match a previous calculation after changing even one input. Every change, no matter how small, ripples through the entire formula.
What Factors Have the Greatest Impact on the Final Result?
Four factors control most of the variation in a weighted average: how weights are distributed, the size of individual values, how many entries exist, and whether extreme values are present.
Weight Distribution
When one entry holds 70% of the total weight, it essentially sets the result. The remaining entries act as minor adjustments. When weights are evenly split, every entry contributes equally. Weight distribution is the single most powerful lever in any weighted average calculation.
Magnitude of Individual Values
A value of 200 with weight 3 contributes 600 to the sum of products. A value of 20 with the same weight contributes only 60. The actual size of each value determines how much raw material the weight has to amplify. Large values with large weights dominate. Small values with small weights become nearly invisible.
Total Number of Entries
Adding more entries generally stabilizes the result because each new entry dilutes the influence of existing ones. A three-entry weighted average is sensitive to every input. A thirty-entry weighted average absorbs individual changes more gracefully. Entry count affects volatility, not accuracy.
Extreme Values
An outlier of 150 in a data set ranging from 60 to 90 will pull the result upward. If that outlier also carries a heavy weight, the pull is dramatic. Extreme values deserve extra scrutiny. Verify they are correct before accepting the result. If you are unsure whether an extreme value should stay, learn when to use a weighted average calculator for proper context.
Which Data Points Matter Most?
The data points that matter most are those with the largest weights attached to values that are furthest from the current average. A weight-10 value right at the average barely moves the result. A weight-10 value 20 points above the average shifts everything upward significantly. Distance from the mean and weight size together determine influence.
Weight Impact Simulator
InteractiveDrag the weight slider to see how increasing a single weight shifts the entire result:
How Do Changes in Weights Affect the Final Result?
Changing any weight reshapes the balance of influence across your entire data set. Increasing a weight amplifies its value's pull. Decreasing a weight mutes it. Equalizing all weights converts the result to a simple average.
Increasing a Weight
When you raise a weight from 2 to 6, that value's contribution triples. If the attached value is above the current average, the result rises. If below, it falls. The magnitude of the change depends on how far the value sits from the weighted average before the adjustment.
Decreasing a Weight
Reducing a weight diminishes the influence of its attached value. If you lower the weight of a low-scoring entry, the average moves upward because that low score now contributes less. This is why reviewing weight assignments is just as important as reviewing the values themselves.
Equalizing All Weights
Setting every weight to the same number eliminates the weighted aspect entirely. The result becomes a simple average because every value now has identical influence. This is useful for testing whether your weights are actually improving accuracy or just adding complexity.
Before-and-After Comparison
| Scenario | Weights (A, B, C) | Result | Change |
|---|---|---|---|
| Equal weights | 3, 3, 3 | 82.33 | Baseline |
| Heavy on A (95) | 8, 3, 3 | 85.36 | +3.03 |
| Heavy on C (65) | 3, 3, 8 | 76.07 | -6.26 |
| A dominant | 15, 1, 1 | 91.47 | +9.14 |
| B dominant | 1, 15, 1 | 78.24 | -4.09 |
Values used: A = 95, B = 78, C = 65. Each scenario shows how shifting weight concentration to different values produces dramatically different results from the same data.
How to Tell Whether Your Result Is Reasonable
A reasonable weighted average always falls between your lowest and highest input values, leans toward the values with the largest weights, and aligns with the general pattern of your data.
Compare with the Highest and Lowest Values
Your weighted average must sit between (or equal to) the minimum and maximum values you entered. If the result is lower than your lowest value or higher than your highest, something is wrong with the inputs. This is the fastest sanity check available.
Check Whether the Result Falls Within the Expected Range
Beyond the mathematical bounds, consider whether the result makes practical sense. A weighted GPA of 3.95 when your highest grade is a 4.0 and most of your heavy courses are A grades makes sense. A weighted GPA of 3.95 when half your courses are B grades does not.
Review Weight Distribution
Look at which entries carry the most weight. The result should intuitively sit near those entries' values. If the entry with weight 10 has a value of 85, and the result is 60, something is likely misconfigured.
Verify Input Consistency
Confirm that values and weights are in the correct fields. A common mistake is entering a weight where a value should go, or vice versa. Swapping a grade of 92 into the weight field and a credit hour of 4 into the value field produces nonsensical results.
Quick Validation Checklist
Why Two People Can Get Different Results from Similar Data
Different weight assignments, different importance criteria, different data subsets, and different objectives all lead to different weighted averages even when the raw values look similar.
Different Weight Assignments
One professor might weight the final exam at 40% and homework at 20%. Another weights them at 30% and 30%. Both use the same student scores, but the different weight structures produce different GPAs. The data is identical. The interpretation of importance is not.
Different Importance Levels
A marketing team and a finance team analyzing the same customer satisfaction data may weight regions differently. Marketing weights by potential market size. Finance weights by current revenue. Same scores, same regions, different results. Both are correct for their respective purposes.
Different Data Sets
Even when two people claim to have the same data, one might include a data point the other excluded. One additional entry with a heavy weight can move the result by several points. Always confirm that both analyses use identical value-weight pairs before comparing results.
Different Objectives
A hiring manager optimizing for retention weights interview scores differently than one optimizing for productivity. The candidate pool is the same. The weighting criteria reflect different business goals. This is not an error. It is weighted averaging doing exactly what it was designed for: reflecting priorities through numbers.
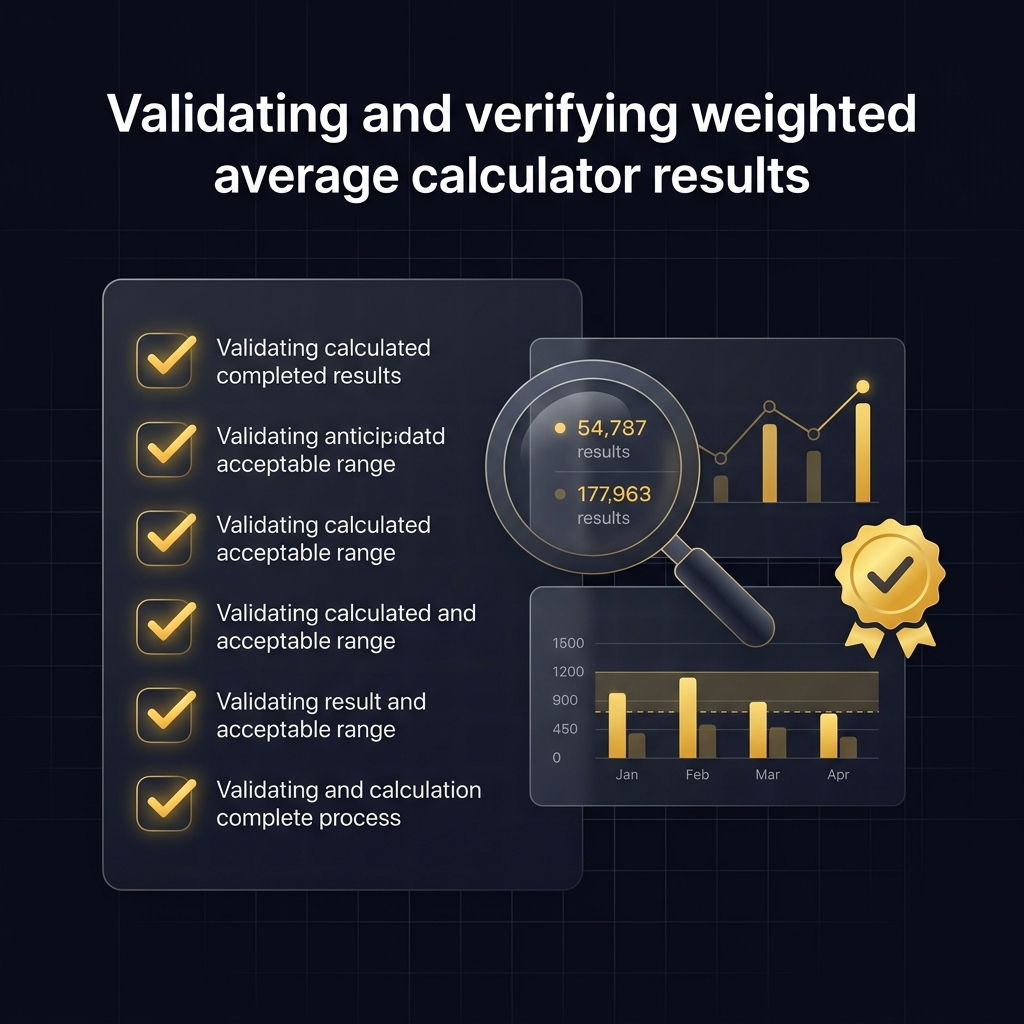
Validating your weighted average result requires checking inputs, bounds, and weight distribution
How to Explain a Weighted Average Result to Others
Explaining a weighted average effectively requires context, a simple analogy, and a clear statement of what the weights represent. Most confusion comes from the audience not understanding why some values count more than others.
Explaining Results in Academic Settings
Tell students and parents: "This number reflects your grades adjusted by how many credits each course carries. A four-credit A counts four times more than a one-credit A because the university considers it four times more significant to your degree." This connects the math to something they already understand: credit hours.
Explaining Business Reports
Tell stakeholders: "This average reflects performance weighted by each division's revenue contribution. A division generating 60% of revenue has 60% influence on the company-wide number. Smaller divisions still affect the result, but their impact is proportional to their business contribution."
Explaining Financial Performance
Tell clients: "Your portfolio return of 8.3% is weighted by how much money you have in each investment. The stock fund holding 70% of your assets drives most of this number. Your bond fund at 10% contributes less because it holds less of your money."
Explaining Survey Findings
Tell teams: "The satisfaction score of 7.8 accounts for how many people responded in each region. Region A with 2,000 respondents carries more influence than Region B with 200. This prevents a small group from disproportionately shaping the overall conclusion."
Presenting Results Clearly
Always state three things: what the result represents, what the weights are based on, and why weighting matters for this specific context. Without all three, the audience will either misunderstand the number or undervalue its accuracy. A clear understanding of what a weighted average calculator is helps frame these conversations.
What Your Weighted Average Result Does Not Tell You
A weighted average is a summary, not a complete picture. It condenses complex data into one number, which means it intentionally leaves out certain details.
It Does Not Measure Data Spread
Scores of 80, 80, and 80 produce the same weighted average as scores of 60, 80, and 100 when weights are equal. The first set has zero spread. The second has wide variation. The weighted average treats both identically. If spread matters to your analysis, you need standard deviation alongside the average.
It Does Not Explain Why Values Differ
The number tells you what the central tendency is, not why one value is 95 and another is 55. Root cause analysis, trend identification, and factor attribution all require separate investigation. The weighted average is the starting point, not the conclusion.
It Does Not Predict Future Performance
A weighted GPA of 3.8 this semester does not guarantee 3.8 next semester. A weighted portfolio return of 12% this year does not promise 12% next year. The result describes historical data. Prediction requires trend models, forecasting tools, and assumptions about the future that a single average cannot provide.
It Cannot Replace Detailed Analysis
Executives sometimes rely on a single weighted metric to evaluate complex situations. That metric is valuable, but decisions deserve a fuller picture. Combine the weighted average with range analysis, individual entry review, and weight sensitivity testing for robust conclusions.
Result Sensitivity Gauge
InteractiveThis gauge shows how sensitive your result is to changing a single value. Adjust Value B to see the impact:
When Should You Review or Recalculate Your Result?
Recalculate your weighted average whenever your inputs change, whether through updated values, adjusted weights, corrected errors, or additional data points. Stale results based on outdated inputs lead to outdated decisions.
After Updating Values
When a new grade comes in, an investment return updates, or a survey batch completes, the underlying values change. Every value change alters the sum of products, which changes the final average. Run the calculation again with the updated numbers.
After Changing Weights
If your grading policy changes from weighting exams at 50% to 40%, every student's weighted average changes even though no grades changed. Weight revisions affect results as powerfully as value revisions.
After Finding Input Errors
A transposed digit, a misplaced decimal, or a value entered in the wrong row can distort results significantly. When you find and fix an input error, always recalculate immediately rather than adjusting the previous result manually.
After Adding New Data
Each new entry introduces a fresh value-weight pair into the formula. Even if the new value equals the current average, its weight changes the total weight divisor, which can shift the result. New data always means a fresh calculation is needed.
Signs That Recalculation Is Needed
Frequently Asked Questions
What does the result of a weighted average calculator mean?
The result represents a single value that accounts for the relative importance of each data point. It reflects how much influence each value has based on its assigned weight, giving you a more accurate summary than treating all values equally.
Why is my weighted average different from my regular average?
A regular average treats all values equally. A weighted average gives more influence to values with larger weights. When weights differ, the two results diverge because the weighted method prioritizes higher-weight data points.
Is a higher weighted average always better?
Not necessarily. A higher result means your high-weight values tend to be larger. Whether that is better depends on context. A higher weighted GPA is desirable, but a higher weighted cost per unit is not.
Can the weighted average be outside the range of my values?
No. A correctly calculated weighted average always falls between the smallest and largest values in your data set. If your result falls outside this range, there is an input error that needs correction.
Why did changing one weight affect the result so much?
Changing a weight alters how much influence that value has. If the value attached to the changed weight is far from the current average, even a small weight change produces a noticeable shift in the output.
What does the total weight represent?
Total weight is the sum of all individual weights. It serves as the divisor in the weighted average formula and tells you the combined scale of importance across all your data entries.
Should I trust the calculator's result?
Yes, as long as your inputs are correct. The calculator applies the standard weighted average formula without rounding errors. Always verify that your values and weights are accurate before relying on the output.
How can I verify that my result is correct?
Check that the result falls between your lowest and highest values. Multiply each value by its weight manually, sum those products, and divide by total weight. If both results match, your calculation is verified.
Why does my result change after adding another value?
Adding a new value introduces additional weight and a new data point. If the new value differs from the current average, it pulls the result toward itself proportionally to its weight.
What should I do if the result looks incorrect?
Review each input for typos, misplaced decimals, or swapped values and weights. Confirm that weights reflect actual importance. Recalculate manually for a small subset to isolate the error.
Conclusion
Understanding what a weighted average calculator result means is just as important as getting the number in the first place. The result is not just a number. It is a data-driven summary shaped by the importance you assigned to every entry. It tells you where the center of gravity sits when some data points carry more weight than others.
My colleague from the opening paragraph re-entered his portfolio data, caught the swapped weights, and discovered his real return was 9.1% instead of 14.2%. That correction changed three investment recommendations his team had built on the wrong number. The calculator was never wrong. His interpretation was. Once he understood what the output actually represented, he never made that mistake again.
Your weighted average result is reliable when your inputs are accurate and your weights reflect genuine importance. Validate it against the range of your values, verify the weight distribution makes sense, and recalculate whenever inputs change. Open the weighted average calculator, run your numbers, and trust the result once you have confirmed the inputs are right.