
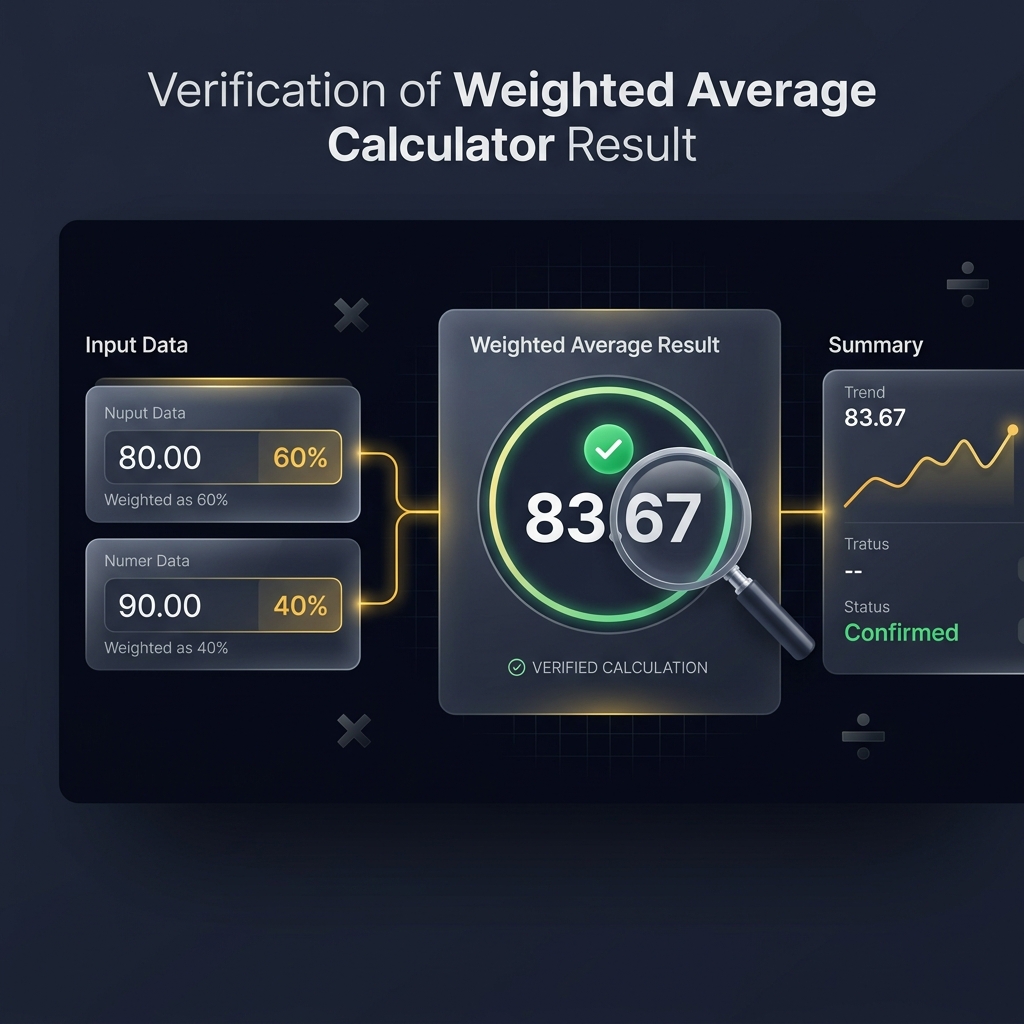
Last year, a finance analyst at a logistics company submitted a vendor cost report that overstated the weighted average shipping rate by 9%. The company renegotiated a contract based on that number. Three weeks later, the procurement team discovered the error: one weight had been entered as 15 instead of 1.5. That single decimal point cost the company $34,000 in unnecessary rate adjustments. The weighted average calculator produced exactly what was entered. The problem was never the tool. It was the unchecked result.
This guide walks you through a proven system for checking any weighted average result before you act on it. You will learn how to audit inputs, apply the formula by hand, test the result against expected boundaries, and stress-test for sensitivity. Every step is practical, and the entire process takes less than five minutes.
Why Verifying a Weighted Average Result Is Important
Weighted averages shape decisions in payroll, academic grading, portfolio analysis, and supply chain management. A result you do not verify is a risk you have not measured.
Preventing Costly Decision Errors
A hiring manager who averages interview scores with the wrong weight on the technical round might reject a strong candidate or advance a weak one. An inventory manager who miscalculates the weighted average cost of goods ends up with financial statements that auditors will flag. Use our weighted average calculator and treat the output as a starting point, not a final answer, until you have checked it.
Building Confidence in the Result
People who check their results present them differently. There is a noticeable shift in confidence when you can say "I verified this three ways" instead of "the calculator said so." That confidence translates into better presentations, stronger recommendations, and fewer follow-up questions from stakeholders who sense hesitation.
When Verification Is Necessary
Any result that feeds a decision affecting money, grades, or people deserves verification. Quick personal estimates do not require formal checking. But if your weighted average will appear in a report, a transcript, a financial filing, or a contract negotiation, the five-minute check is not optional. It is the minimum standard for professional work.
Real-World Consequences of Incorrect Results
A university registrar in 2025 discovered that a batch GPA calculation tool had been applying credit hours in reverse order for 47 students across two semesters. Students with high credit-hour courses in difficult subjects had inflated GPAs, while others had deflated ones. The fix required manual recalculation of every affected transcript. The root cause was a copy-paste error in the data feed that swapped column positions for values and weights.
Input Audit Simulator
InteractiveEnter your values and weights below. The tool flags common mistakes automatically:
Before Verifying the Result, Check Your Input Data
Eighty percent of weighted average errors come from bad inputs, not bad math. Checking data before checking calculations saves you from chasing phantom formula errors.
Confirm Every Value Is Correct
Read each value against the source document. If you are averaging exam scores, compare each number to the official grade report. If you are averaging product costs, compare each price to the purchase order. A transposition error like typing 89 instead of 98 shifts the result and looks plausible enough to escape casual review.
Confirm Every Weight Is Correct
Weights represent importance, and they must come from a reliable source. Credit hours come from the registrar. Portfolio allocations come from the brokerage account. Project priorities come from the project charter. Guessed weights undermine the entire calculation regardless of how accurately you run the formula.
Match Each Value with Its Weight
A value paired with the wrong weight produces a result that is mathematically valid but factually meaningless. If your highest exam score gets the lowest weight because the rows shifted during copy-paste, the weighted average calculator cannot detect the mismatch. It trusts what you give it. You need to verify alignment before the data reaches the tool.
Remove Duplicate or Missing Entries
A doubled row inflates the influence of one value. A missing row eliminates the influence of another. Both produce results that pass every mathematical check but fail every factual one. Count your entries and compare the total to the number of items you intended to include.
Input Verification Checklist
Compare the Calculator Result with the Weighted Average Formula
The weighted average formula multiplies each value by its weight, sums all products, and divides by the sum of weights. Recreating this by hand or in a spreadsheet confirms the calculator applied the correct logic.
Calculate the Sum of Value Times Weight
Take each value-weight pair and multiply them. For four quarterly returns of 5.2%, 3.8%, 7.1%, and 4.5% with investment amounts of $10,000, $15,000, $8,000, and $12,000, the products are 52,000, 57,000, 56,800, and 54,000. Sum them: 219,800.
Calculate the Sum of All Weights
Add all weights: 10,000 + 15,000 + 8,000 + 12,000 = 45,000. This is your divisor. Every weight must be a positive number. A negative weight has no standard interpretation in weighted averaging and signals a setup error.
Compare Both Results
Divide: 219,800 / 45,000 = 4.884%. Compare this to the calculator output. If both numbers agree within 0.01, you have confirmed the result. If the gap exceeds 0.01, check for rounding differences first, then look for data entry discrepancies. Understanding how a weighted average calculator works internally helps you pinpoint where a discrepancy originates.
Formula Verification Example
Step-by-Step Formula Checker
Try It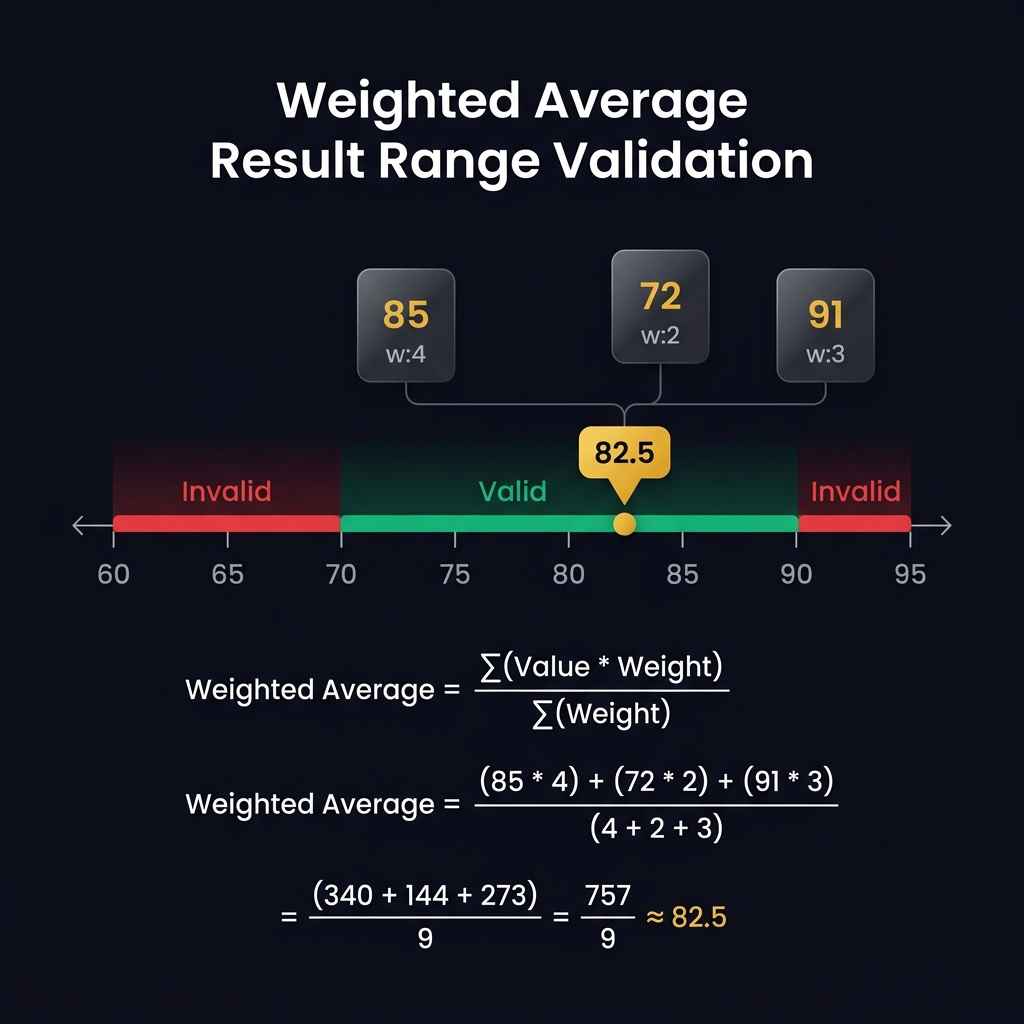
A correct weighted average must always fall between the lowest and highest input values
Check Whether the Result Falls Within the Expected Range
A weighted average with positive weights must always land between the smallest and largest input values. Any result outside this boundary is definitively wrong.
Compare with the Minimum Value
Identify the lowest value in your data set. If you entered scores of 68, 82, and 91, the floor is 68. Your weighted average cannot go below 68 under any positive weight combination. A result of 64 means something in your data is wrong, not borderline wrong, but structurally broken.
Compare with the Maximum Value
The ceiling in the same example is 91. Even if you assign weight 100 to the 91 and weight 1 to everything else, the result still cannot exceed 91. It gets extremely close, but crossing the boundary is mathematically impossible with valid positive weights.
Why the Result Should Stay Within the Data Range
A weighted average is a blend of your values, pulled toward each one in proportion to its weight. Since you are mixing known quantities, the blend cannot create a new value beyond what you started with. This is the most powerful quick check available. It requires no recalculation, just a comparison.
When an Out-of-Range Result Indicates an Error
If the result exceeds the maximum or falls below the minimum by any amount, treat it as a confirmed error. Do not round it back into range. Do not assume the calculator used a different rounding mode. Investigate the inputs. Common causes include a negative sign on a weight, an extra zero appended to a value, or a decimal point in the wrong position.
Range Boundary Tester
DiagramVerify That Every Weight Has Been Applied Correctly
Correct weight application shifts the result toward higher-weighted values. Testing this directional pull confirms that the weights are connected to the right values.
High-Weight Values Should Influence the Result More
Examine your result and ask a directional question: does it sit closer to the value with the biggest weight? If you gave weight 8 to a value of 90 and weight 1 to a value of 50, the result should be much closer to 90. A result near 70 suggests the weights are either swapped or not applied at all.
Zero Weights Should Have No Effect
If you assign weight zero to any value, that value should be excluded from the result. Test this by temporarily setting one weight to zero. The result should change. If it does not, the tool may be treating empty weights differently than you expect.
Equal Weights Should Produce the Same Result as a Simple Average
Set all weights to the same number. The weighted average should now equal the simple arithmetic mean of your values. This is a fast and definitive test. If equal weights produce a different result than the simple average, the calculation engine has a bug or the data is corrupted.
Quick Weight Influence Test
| Test Scenario | What Should Happen | If It Fails |
|---|---|---|
| Highest weight on highest value | Result pulls toward that value | Weights may be misaligned |
| Set one weight to zero | That value drops out of the result | Tool may assign default weight |
| Make all weights identical | Result equals simple average | Calculation logic is incorrect |
| Double the largest weight | Result moves further toward that value | Weight doubling not applied correctly |
| Swap two weights | Result shifts toward newly higher-weighted value | Values and weights are not linked |
Validate the Total Weight
The denominator in the weighted average formula is the sum of all weights. An incorrect total weight distorts every result, even when individual inputs are perfect.
Check the Sum of All Weights
Add your weights manually. Compare the sum to the divisor used in the calculation. If you have five courses worth 3, 4, 3, 3, and 4 credit hours, the total should be 17. If the calculator uses 16 or 18, one weight has been altered or an entry was skipped.
Percentage Weights vs Numeric Weights
Percentage weights should sum to 100. Numeric weights can sum to any positive number. Mixing formats within one calculation is a guaranteed source of errors. A weight of "40" entered alongside "0.3" and "0.2" makes the first entry dominate the result. The guide on when to use a weighted average calculator explains how to select the right weight format for different scenarios.
When Weight Totals Do Not Equal 100%
Some tools normalize weights automatically. Others require manual totals. If your weights sum to 80 instead of 100, a normalizing tool divides by 80 and gives a valid result. A non-normalizing tool divides by 80 and gives the same valid result mathematically, but you need to know whether 20% of weight is unaccounted for in your data model.
Auto-Normalization vs Manual Weight Totals
| Approach | How It Works | Best For |
|---|---|---|
| Auto-normalization | Divides by actual sum of weights | Credit hours, units, investment amounts |
| Strict percentage totals | Requires weights to sum to exactly 100% | Course grading, budget allocation |
| Proportional weights | Weights sum to 1.0 | Statistical models, probability weighting |
Cross-Check the Result Using Another Method
Independent verification with a different tool or method is the gold standard for confirming accuracy. When two independent approaches agree, the probability of a shared error becomes negligible.
Manual Verification
Take a pen, a notepad, and a basic calculator. Multiply every value by its weight, sum the products, sum the weights, and divide. This fundamental step catches any formula error that automated tools might silently propagate. If you enjoy working through the math, our guide on calculating weighted averages manually provides detailed step-by-step examples.
Spreadsheet Verification
Open Google Sheets or Microsoft Excel. Put values in column A, weights in column B. In C1, enter =A1*B1 and drag down. Sum column C. Sum column B. Divide. The spreadsheet preserves full precision and gives you a permanent record for auditability. It takes 60 seconds to set up and answers the correctness question definitively.
Independent Calculator Verification
Enter the same data into a second weighted average tool. If both calculators agree, the result is confirmed. If they disagree by more than 0.01, investigate the rounding settings before assuming either tool is wrong. Most disagreements between calculators trace back to decimal display precision, not formula errors.
Why Independent Verification Improves Confidence
Two independent methods producing the same result is powerful evidence of correctness. The probability that two unrelated tools both produce the same wrong answer from the same inputs is extraordinarily low. Financial auditors require this type of dual verification for every material calculation. Academic researchers use it for published results. The practice works because errors in one method are statistically independent from errors in another.
Stress-Test Your Result
Sensitivity testing reveals whether your result behaves predictably when you nudge a single input. Predictable responses confirm correct weight-value connections. Erratic behavior signals a problem.
Change One Weight Slightly
Increase one weight by 1. The result should shift toward the associated value by a small, proportional amount. If a weight of 4 becomes 5, and the associated value is above the current weighted average, the result should increase. If it decreases, the weight is connected to the wrong value.
Modify One Value
Change one value from 80 to 82. The result should shift upward by an amount proportional to that value's weight relative to total weight. If the value has weight 3 out of total weight 10, the result should increase by roughly 0.6. An increase of 2 or zero suggests a calculation problem.
Observe How the Result Responds
A well-functioning weighted average moves smoothly and predictably. Small input changes produce small output changes. The direction of movement matches the direction of your edit. The magnitude is proportional to the relative weight. Any discontinuity, reversal, or non-response deserves investigation.
Understanding Sensitivity to Weight Changes
Weight Sensitivity Tester
InteractiveAdjust the weight of Value A to see how the weighted average responds:
Warning Signs That Your Result May Be Incorrect
Certain patterns reliably indicate errors. Recognizing these red flags early prevents you from building reports and decisions on flawed data.
Result Outside the Expected Range
The most definitive error signal. If your input values range from 70 to 95 and the result is 58 or 103, stop immediately. This is never acceptable and always indicates corrupted inputs or a formula error.
Missing Value-Weight Pair
If you have six values but only five weights, the calculator handles the mismatch unpredictably. Some tools ignore the extra value. Others assign a default weight of 1. Neither behavior matches your intent. Always count your pairs before calculating.
Incorrect Weight Scale
Mixing percentage weights (25, 35, 40) with raw counts (3, 5, 7) in one calculation produces a result that cannot be interpreted. The person using 25 meant "25% of the total." The person using 3 meant "three credit hours." Both are valid weight systems. Combining them is not.
Unexpectedly Large Changes
Adding one new value-weight pair should not shift the result by more than a few percentage points in most real-world scenarios. If adding a sixth data point moves the weighted average from 82 to 71, the new entry might have an abnormally large weight or an abnormally distant value that needs verification.
Quick Error Detection Guide
Error Detection Flowchart
DiagramHow Rounding Can Affect Verification
Rounding is the most common source of small discrepancies between a manual check and a calculator output. Understanding where rounding occurs prevents you from flagging correct results as wrong.
Intermediate Rounding
When you round each product before summing, you lose precision at every step. A product of 267.333 rounded to 267.33 loses 0.003. Across eight entries, that error can accumulate to 0.02 or more in the final answer. The fix is simple: do not round until the very end.
Final Rounding
Calculators compute at full floating-point precision and round only for display. Your manual check should do the same. Complete all multiplications, additions, and the final division at full decimal precision. Then round the result to the same number of decimal places the calculator uses.
Decimal Precision Differences
If one tool shows 84.33 and another shows 84.333, both are correct. The difference is display precision, not calculation accuracy. Before investigating a discrepancy, check the decimal settings of both tools. Align them to the same precision, then compare.
When Small Differences Are Acceptable
A difference of 0.01 or less between manual and automated results is almost always a rounding artifact. Accept it without further investigation. A difference between 0.01 and 0.1 warrants a quick check of your intermediate rounding discipline. A difference above 0.1 signals a real error in inputs or formula application that requires full investigation.

Complete the five-point accuracy audit before trusting any weighted average result
Verification Checklist Before You Trust the Result
This five-point checklist covers every verification dimension. Complete it before using any weighted average result in a decision, report, or public document.
Inputs Verified
Every value and weight is confirmed against the source. No duplicates exist. No entries are missing. Each value is paired with its correct weight.
Formula Confirmed
A manual recalculation using sum-of-products divided by sum-of-weights produces a result that matches the calculator within 0.01.
Weight Totals Reviewed
The sum of all weights matches your expectation. Percentage weights total 100 or the tool normalizes properly. No negative or zero-sum weight situations exist.
Result Range Checked
The weighted average falls between the smallest and largest input values. It leans toward the value carrying the most weight.
Independent Cross-Check Completed
At least one alternative method, whether manual, spreadsheet, or a second calculator, confirms the result.
Five-Minute Accuracy Audit
Best Practices for Consistently Accurate Weighted Average Results
Building verification into your workflow prevents errors from reaching decisions. These four habits cost minutes and save hours of correction work.
Keep Units Consistent
If values represent percentages, every value must be a percentage. If weights represent dollar amounts, every weight must be in dollars. A single mismatched unit invalidates the entire calculation. Consistency is non-negotiable.
Use One Weight Format Throughout
Decide before you begin whether weights are percentages summing to 100, proportions summing to 1.0, or raw counts summing to any positive number. Document your choice. Share it with anyone who touches the data. A format mismatch between contributors is the second most common weighted average error after data entry mistakes.
Document Weight Sources
Write down where every weight comes from. "Credit hours per Fall 2026 registrar schedule" is verifiable. "I estimated about 3" is not. Documentation turns a one-time calculation into a repeatable, auditable process that anyone on your team can verify independently.
Save Original Data
Before entering values and weights into any calculator, save the raw data in a spreadsheet or file. If a result is questioned months later, you can retrace every input. Without saved originals, re-verification becomes impossible and the conversation shifts from facts to memory.
Creating a Repeatable Verification Process
Embed the five-minute audit into your standard operating procedure. Calculate, verify against the checklist, then share. Teams that formalize this process report dramatically fewer data corrections in subsequent reviews. The workflow becomes automatic within two weeks of consistent practice, and the confidence it provides is immediately noticeable in team discussions and stakeholder presentations.
Frequently Asked Questions
How can I verify a weighted average calculator result?
Multiply each value by its weight, sum the products, then divide by the sum of all weights. Compare this manual answer to the calculator output. Agreement within 0.01 confirms the result. Any larger gap warrants investigation of your inputs and rounding methods.
How do I know if my weighted average is correct?
A correct result always falls between the smallest and largest input values and leans toward the value with the highest weight. If both conditions hold, and a manual recalculation matches, the result is correct.
Should a weighted average always fall between the smallest and largest values?
Yes, when all weights are positive. The weighted average is mathematically bounded by the minimum and maximum input values. Any result outside this range indicates a data entry error or negative weight that needs correction.
Why does my manual answer differ from the calculator?
Intermediate rounding is the most common cause. Calculators maintain full decimal precision throughout the calculation. Manual methods that round products before summing accumulate small errors that shift the final answer by 0.01 to 0.05.
Do weights have to total 100% for the result to be valid?
No. The formula divides by the actual sum of weights, so normalization is built in. Weights of 2, 3, and 5 yield the same weighted average as weights of 20%, 30%, and 50%. The total does not need to equal 100 for the math to work correctly.
Can rounding affect the final weighted average?
Yes. Rounding intermediate products before summing introduces cumulative error. The solution is to complete all arithmetic at full precision and round only the final result. This practice eliminates rounding discrepancies entirely.
What should I check first if the result seems wrong?
Start with your input data. Confirm that every value and weight is entered correctly and paired with the right partner. Input mistakes are responsible for the vast majority of incorrect weighted average results.
Is it normal for different calculators to show slightly different decimals?
Yes. Different tools display different levels of decimal precision. A difference in the third or fourth decimal place is a display setting variation, not a calculation error. Align decimal settings before comparing.
How can I validate percentage-based weights?
Sum all percentage weights. A complete data set should total 100%. If the sum falls short, an entry is missing. If it exceeds 100%, a weight has been duplicated or inflated. Correct the total before recalculating.
What is the fastest way to confirm a weighted average calculation?
Two quick checks take under 15 seconds. First, confirm the result falls between your smallest and largest values. Second, verify it sits closer to the value with the highest weight. These two tests catch the majority of errors without a full recalculation.
Final Thoughts
Checking a weighted average calculator result is about protecting the decisions that depend on it. The tool handles the math perfectly. What it cannot do is confirm that you entered the right numbers, paired the right values with the right weights, or used a consistent weight format. Those responsibilities belong to you.
The logistics analyst from the beginning of this article now runs the five-point checklist on every weighted average before it leaves the spreadsheet. The team has not submitted a data correction in three quarters. The five-minute audit costs almost nothing in time and prevents the kind of errors that cost thousands of dollars and weeks of rework.
What weighted average result will you check next? Open the weighted average calculator, enter your data, run through the checklist, and confirm the number before it shapes your next decision. Five minutes of checking today prevents months of compounding consequences.